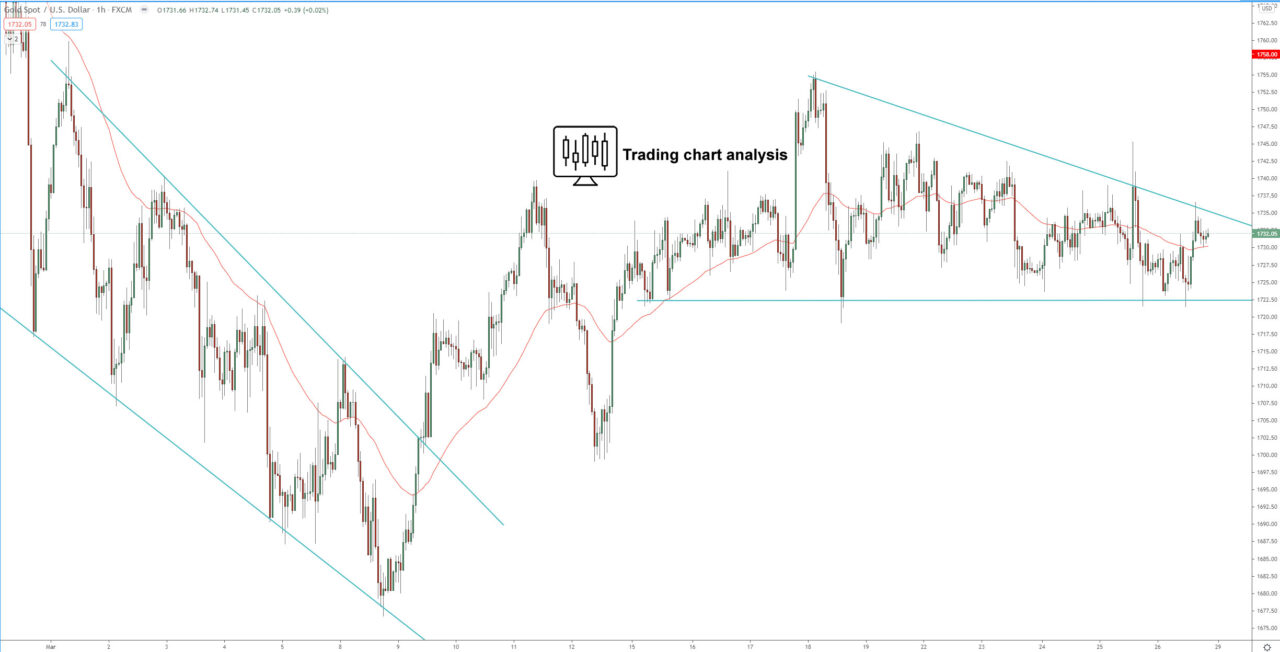
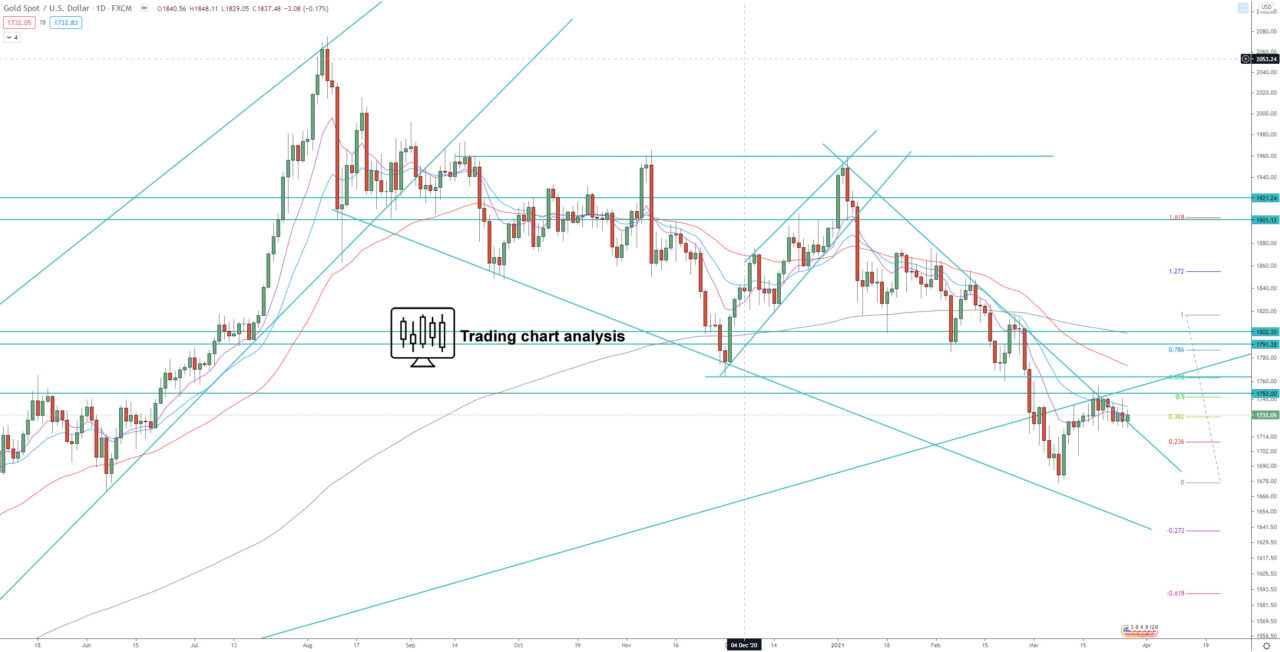
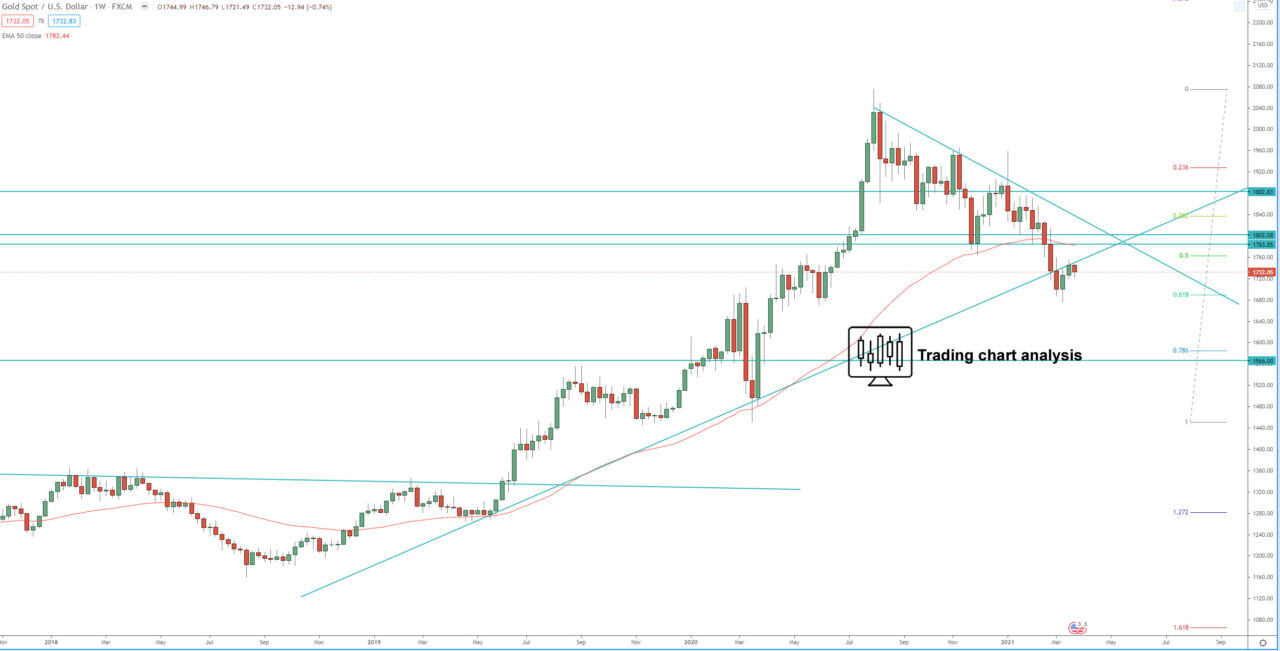
Technical analysis for Gold is showing that the price reached support, 0.618 FIB retracement and the second target of the daily bearish trend at 1670 and bounced from it. Now the price is consolidating on the daily chart underneath horizontal and dynamic resistance. This consolidation on the daily chart is forming as a descending triangle on the 1H chart. If the price of the Gold jump above the descending triangle on the 1H chart, it will be a signal for a further rise toward, first 1755, a break above 1755 will send the price toward 1762-1765. If the bullish momentum continues and carries the price above the strong resistance (previous double bottom support) around 1765, it will accelerate the bullish move toward, first 1780 and second 1800.
However, if the XAU/USD breaks below the descending triangle on the 1H chart, it will resumе the bearish daily trend and send the price toward, first 1700, second the previous low at 1676-1670.
Review our technical analysis for XAU/USD pair for 2021 targets.
1H chart:

Daily chart:

Weekly chart:


