|
Getting your Trinity Audio player ready...
|
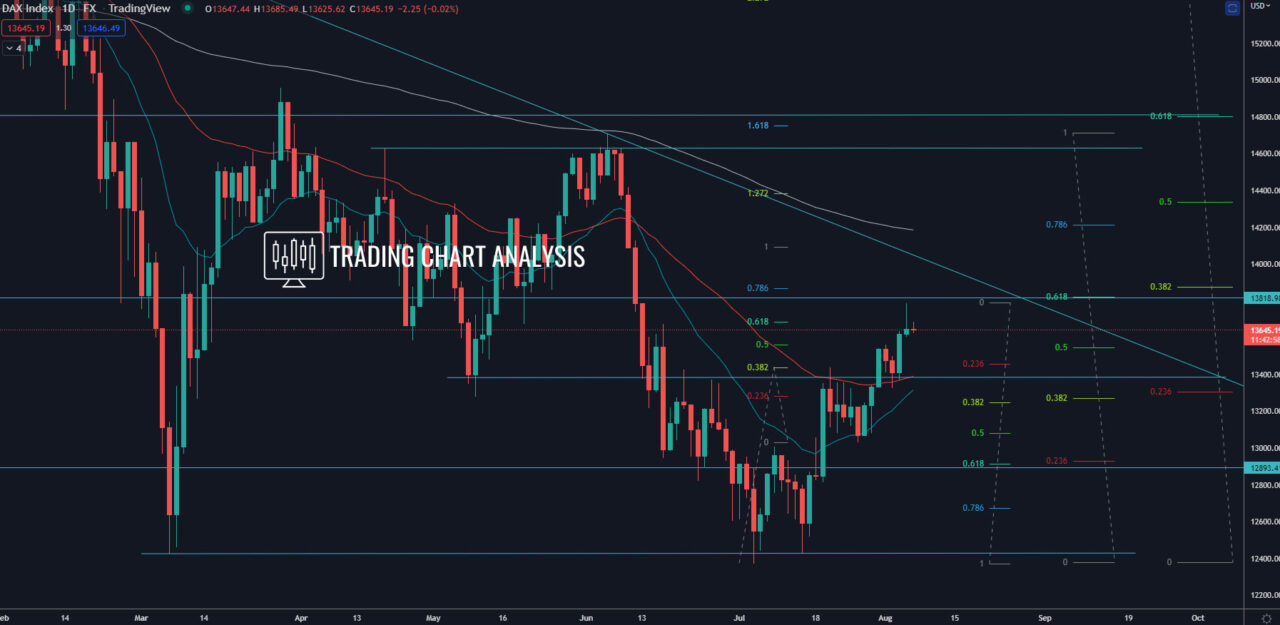
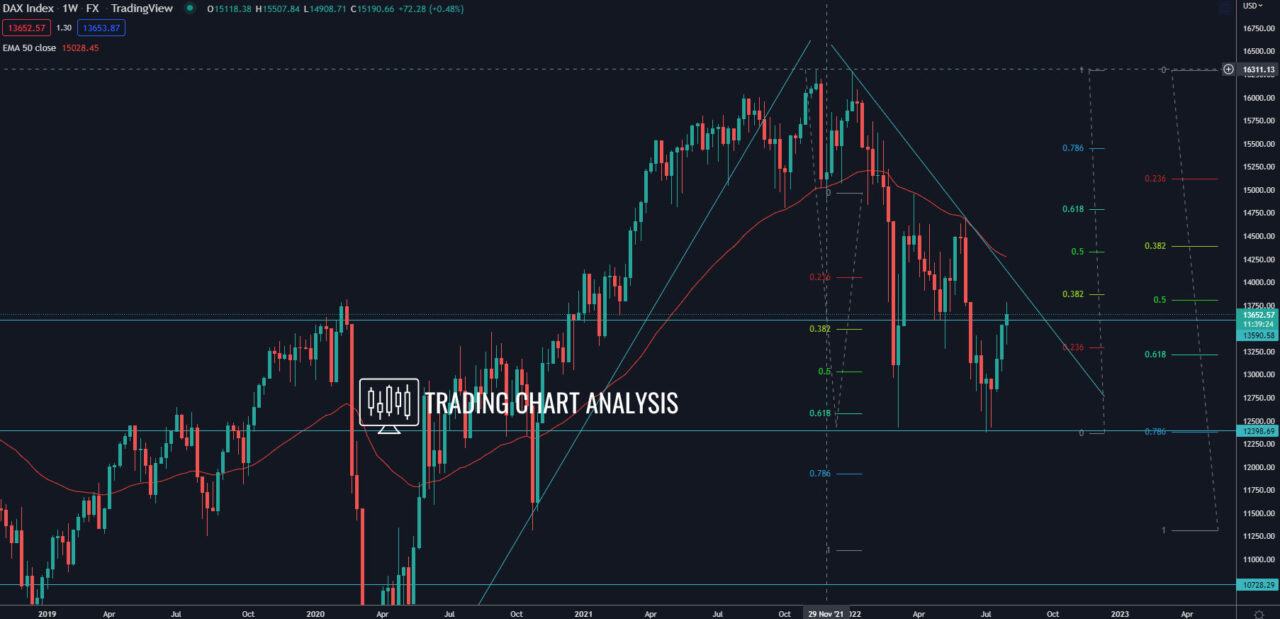
Technical analysis for the German DAX, the index formed a double bottom on both, the weekly and the daily charts. The first target for this pullback is the 0.618 FIB retracement on the daily chart at 13 815, which is just below the 0.382 FIB retracement on the weekly chart at 13 875.
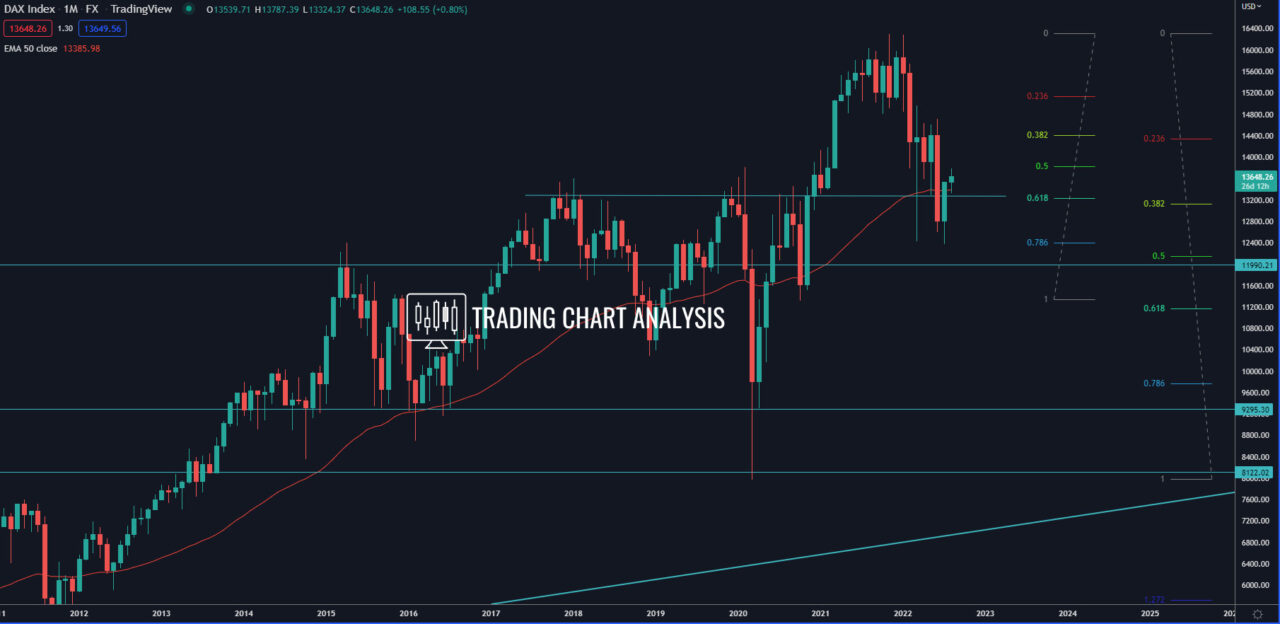
If the index DAX 40 breaks above the 0.382 FIB retracement on the monthly chart, that will open the door for a run toward the weekly 50 EMA at 14 280, where there is a descending trend line. The third target is the 1.272 FIB extension on the daily chart at 14 385. The fourth target for the pullback in the German DAX index is the 1.618 FIB extension on the daily chart at 14 750, which is within a strong resistance zone.
On the other hand, a break below the daily 50 EMA on the daily chart will send the DAX index lower, toward, first the daily low at 13 0 31. The second target for such a bearish development is the 0.618 FIB retracement on the daily chart at 12 915, which is also a support. The third target is the previous low on the weekly chart at 12 373.
Looking at the bigger picture, the breakout in June on the monthly chart, when the German DAX closed below the resistance and the 0.382 FIB retracement, opened the door for further declines. The second target for this decline is the 0.618 FIB retracement on the monthly chart at 11 170, which is at the 100% FIB extension on the weekly chart. The third target is the 1.272 FIB extension on the weekly chart at 10 050.
Daily chart:

Weekly chart:

Monthly chart:


