|
Getting your Trinity Audio player ready...
|
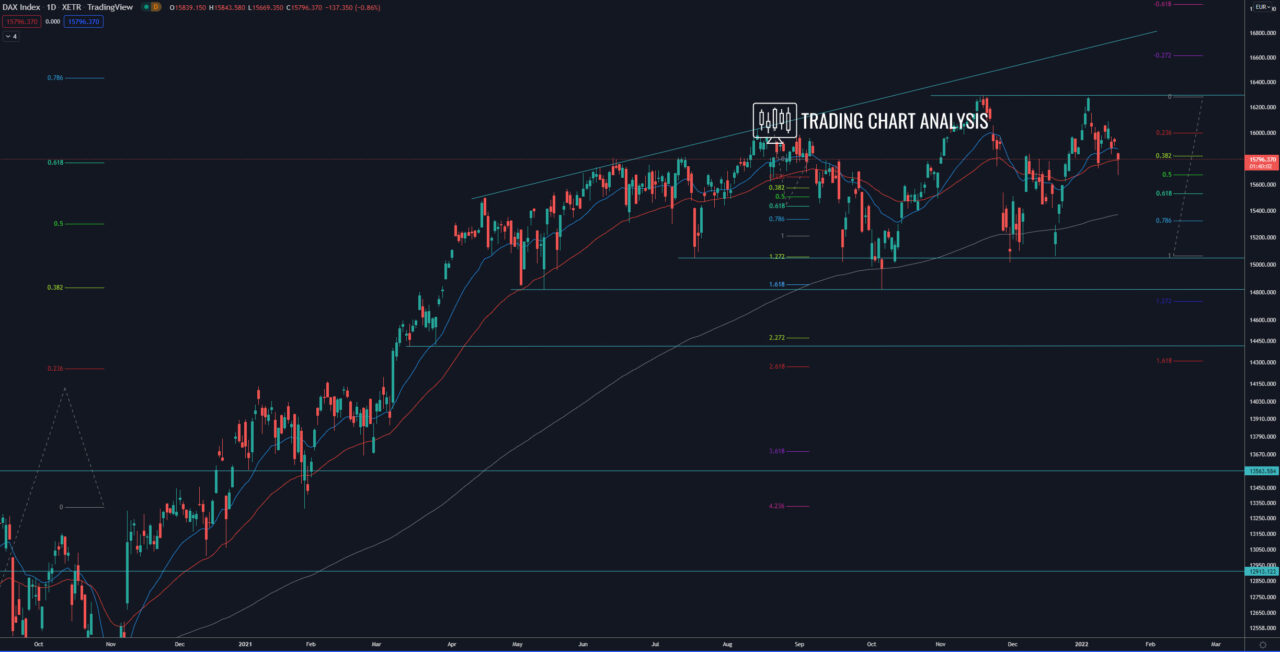
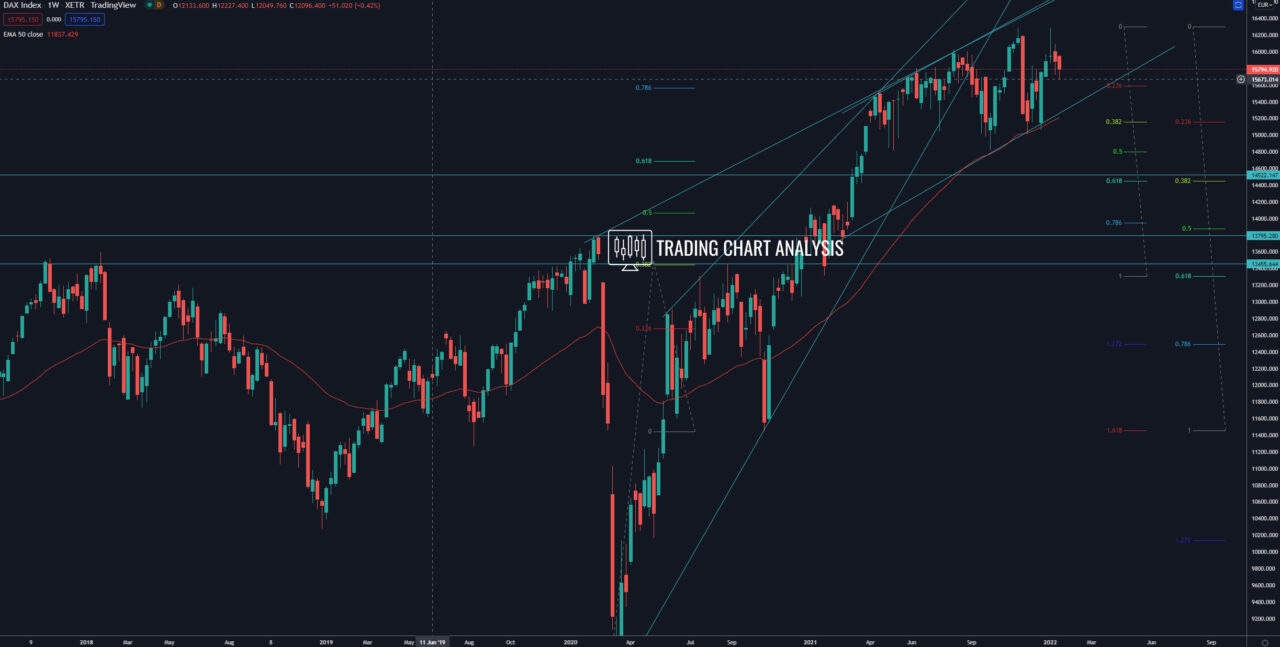
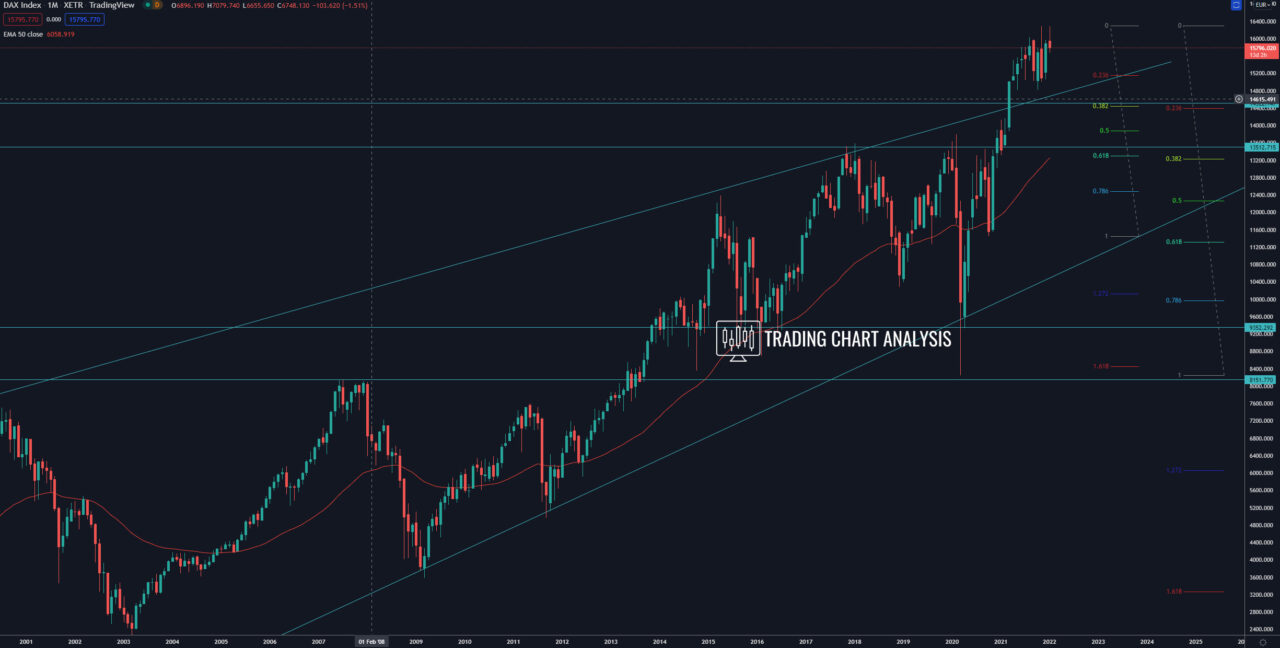
Technical analysis for the German DAX, the index is within the third bullish wave on the quarterly chart. The first target for the quarterly bullish wave is the 1.272 FIB extension at 18 350 – 18 400. On the weekly chart, the German DAX index is within its third bullish wave, the first target for this wave is the 1.272 FIB extension at 18 100. On the daily chart, the German DAX index is also within its third bullish wave, the third target of this wave is the 2.272 FIB extension at 16 950 – 17 000. The fourth target of the third bullish wave on the daily chart is the 2.618 FIB extension at 18 000.
However, the German DAX index formed a double top on the weekly and the daily chart, which is a signal for a pullback. The first target for this pullback is the 0.382 FIB retracement on the weekly chart at 15 155. The second target is the previous weekly low at 15 015. And if the German DAX index breaks below 15 015, that will open the door for further decline. The first target for this potential bearish break is at the weekly low at 14 818. The second target is the 0.618 FIB retracement on the weekly chart at 14 450, which is at the 0.382 FIB retracement on the monthly chart.
Daily chart:

Weekly chart:

Monthly chart:


