|
Getting your Trinity Audio player ready...
|
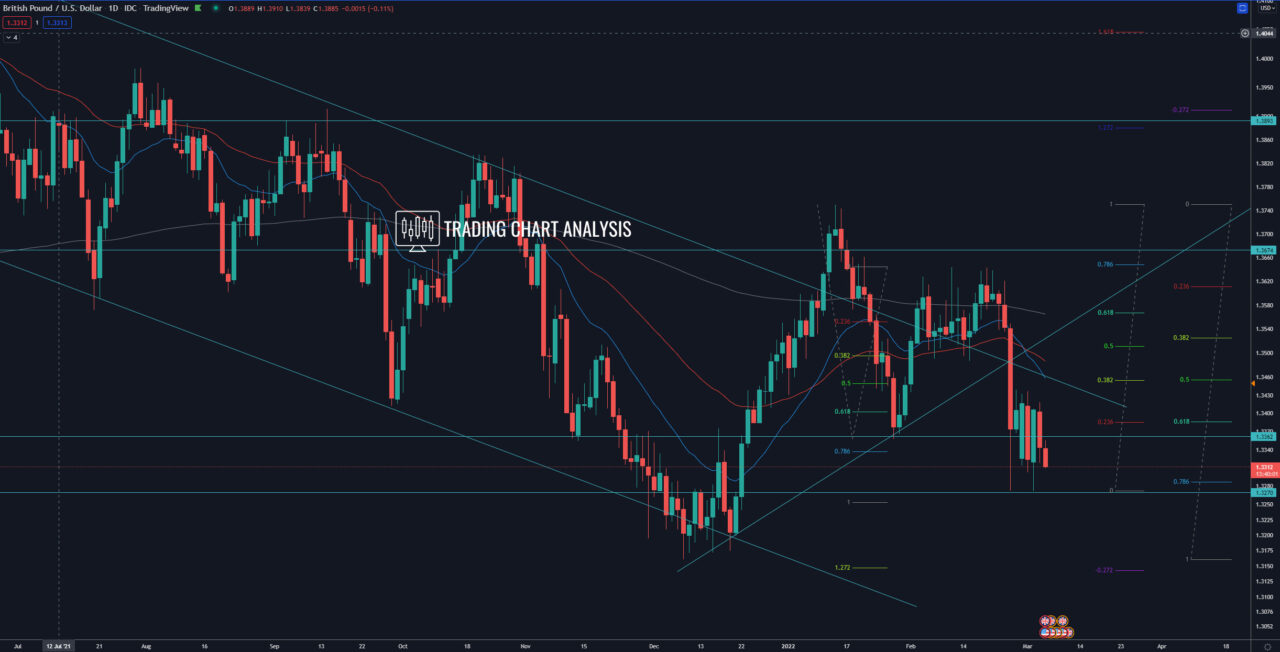
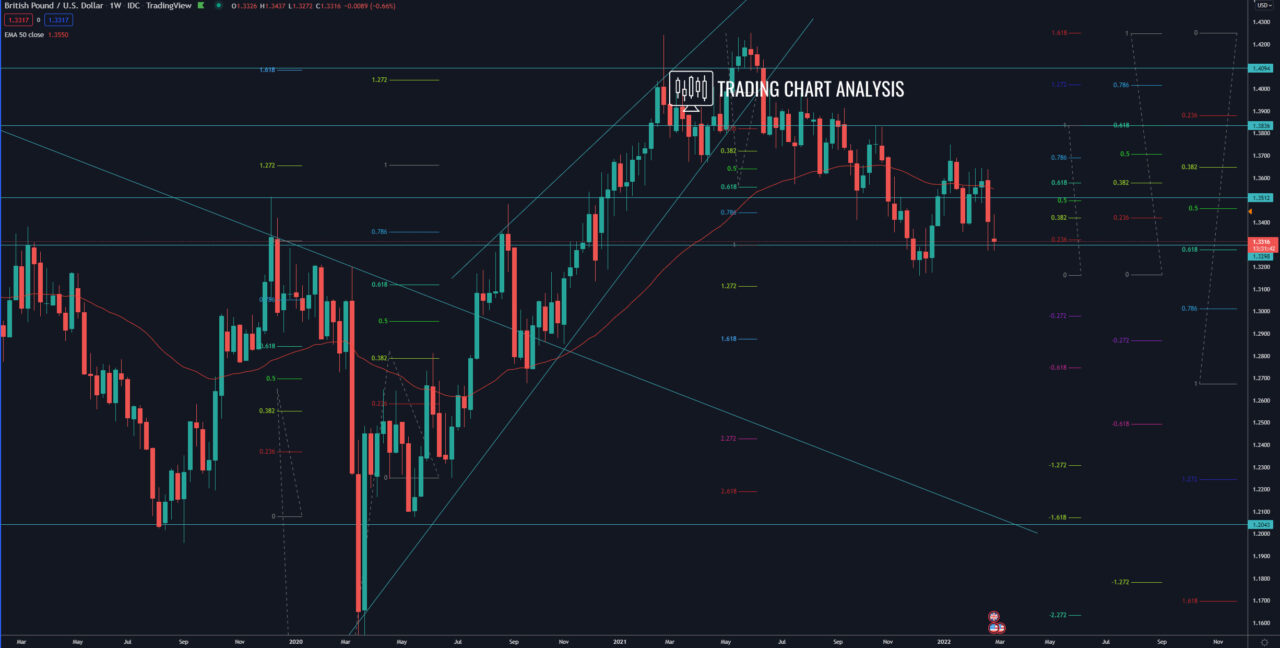
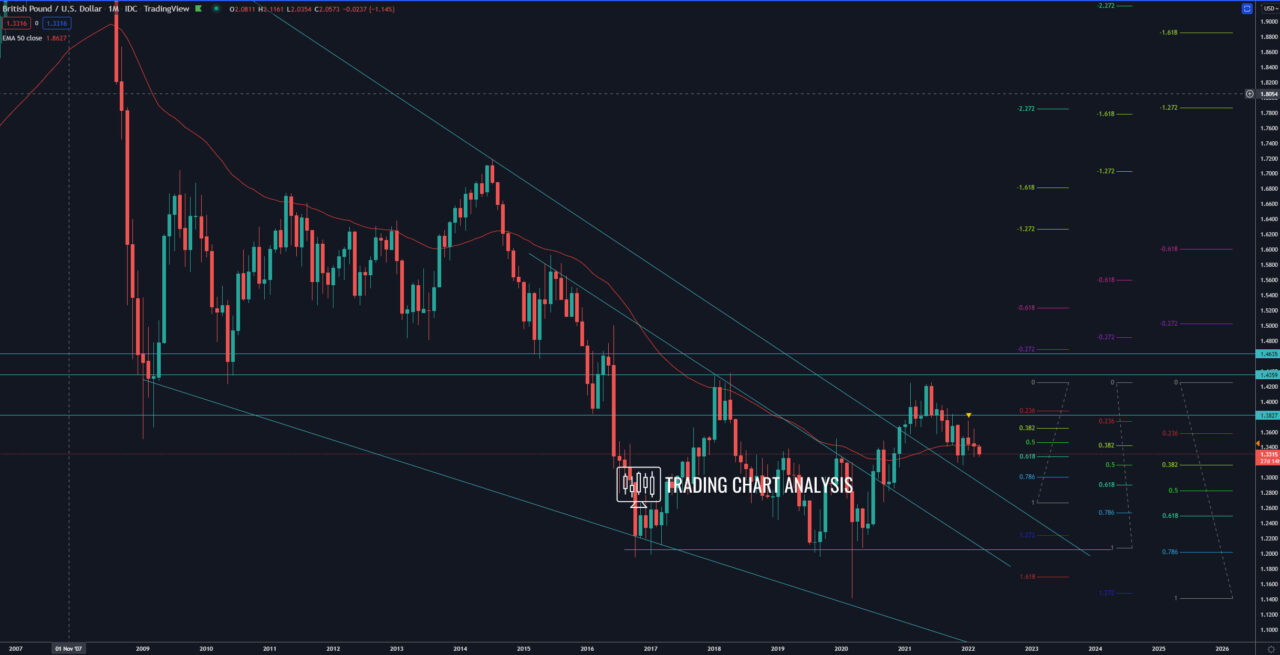
Technical analysis for the GBP/USD, the pair broke below the daily low at 1.3358, resuming the bearish trend. The first target of this bearish breakout is the 1.272 FIB extension on the daily chart at 1.3150, which is close to the previous daily low at 1.3161. The second target at the 1.618 FIB extension at 1.3010. If the GBP/USD breaks below the previous daily low at 1.3161, that will open the door for a bearish run toward the 1.618 FIB extension on the weekly chart at 1.2875. And on the monthly chart, we have the 0.618 FIB retracement at 1.2910 and the 0.500 FIB retracement at 1.2835, that zone between 1.2911-1.2835 is a target for the bears in case of a break below 1.3161.
On the other hand, if the GBP/USD rejected the weekly low at 1.3161 and form a double bottom, that could be a beginning of a bullish run.
Traders are now watching the range on the four-hour chart, a break above 1.3439 could trigger a pullback toward the 1.3550.
Daily chart:

Weekly chart:

Monthly chart:


