|
Getting your Trinity Audio player ready...
|
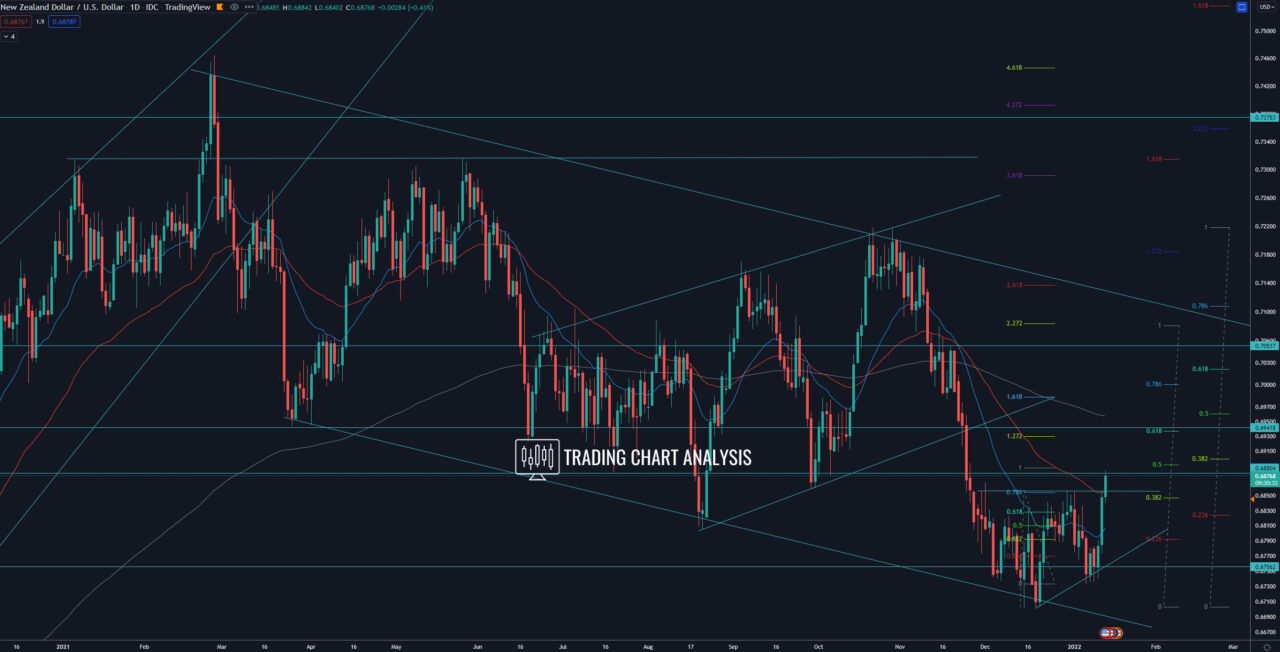
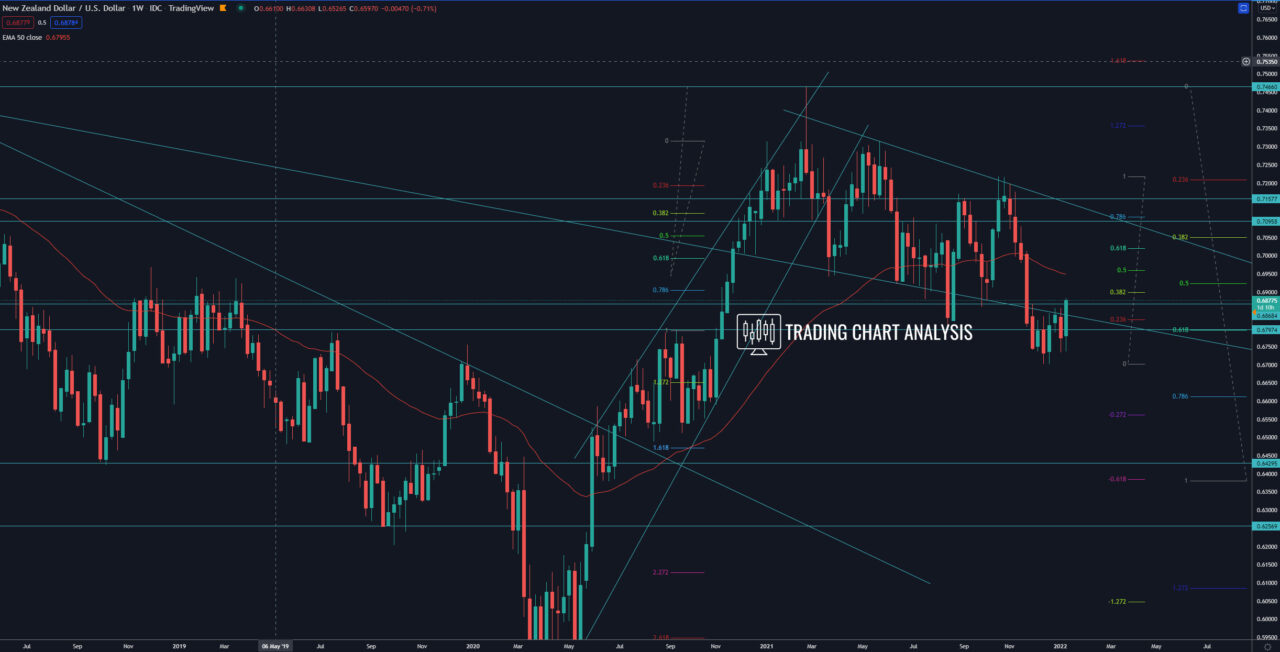
Technical analysis for the NZD/USD, the pair broke above the daily 50 EMA and the previous high. This breakout started a bullish run on the daily chart. The first target for the bullish run is the 0.382 FIB retracement on the weekly chart at 0.6900. The second target is the 0.500 FIB retracement on the weekly chart at 0.6960. And the third target for the bullish run for the NZD/USD is the 0.618 FIB retracement on the weekly chart at 0.7020.
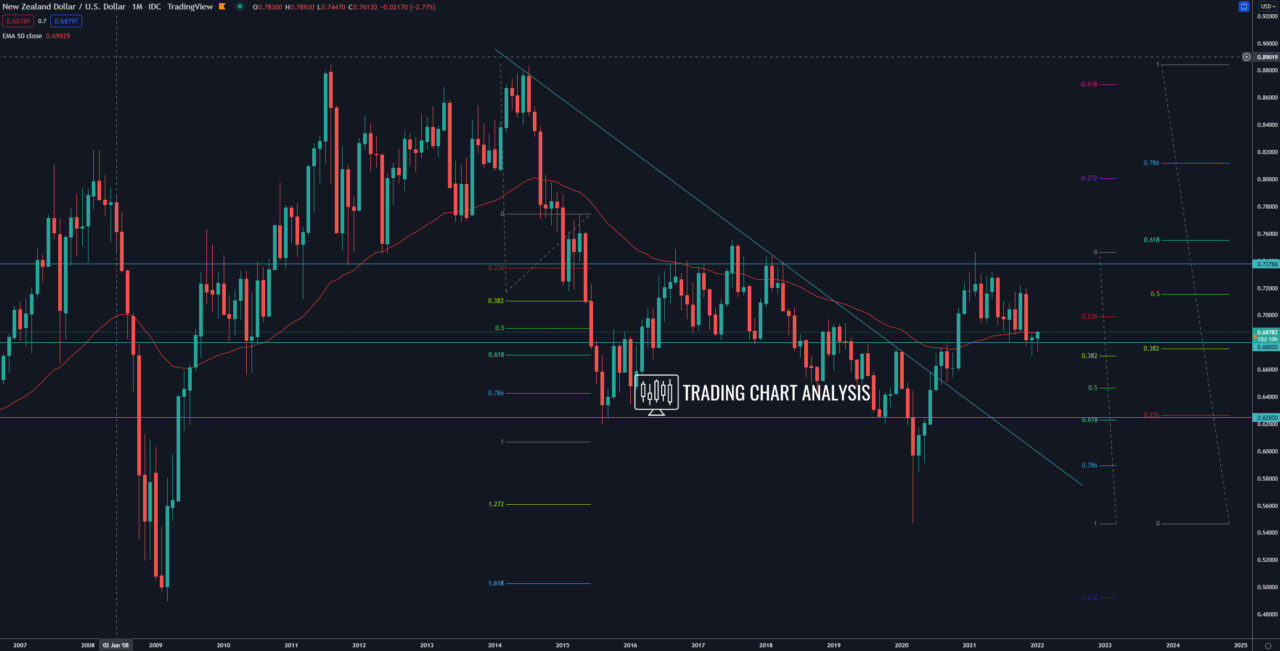
On the other hand, the bullish breakout on the daily chart can be viewed as an ABC pullback. Therefore, if the NZD/USD pair failed to hold and trade above 0.6900, we may see a resumption of the bearish trend. The previous monthly/weekly low at 0.6700, which is a 0.382 FIB retracement on the monthly chart, is key support now. A break below 0.6700 will open the door for a bearish run for the NZD/USD pair, toward the 0.500 FIB retracement on the monthly chart at 0.6460.
Daily chart:

Weekly chart:

Monthly chart:


