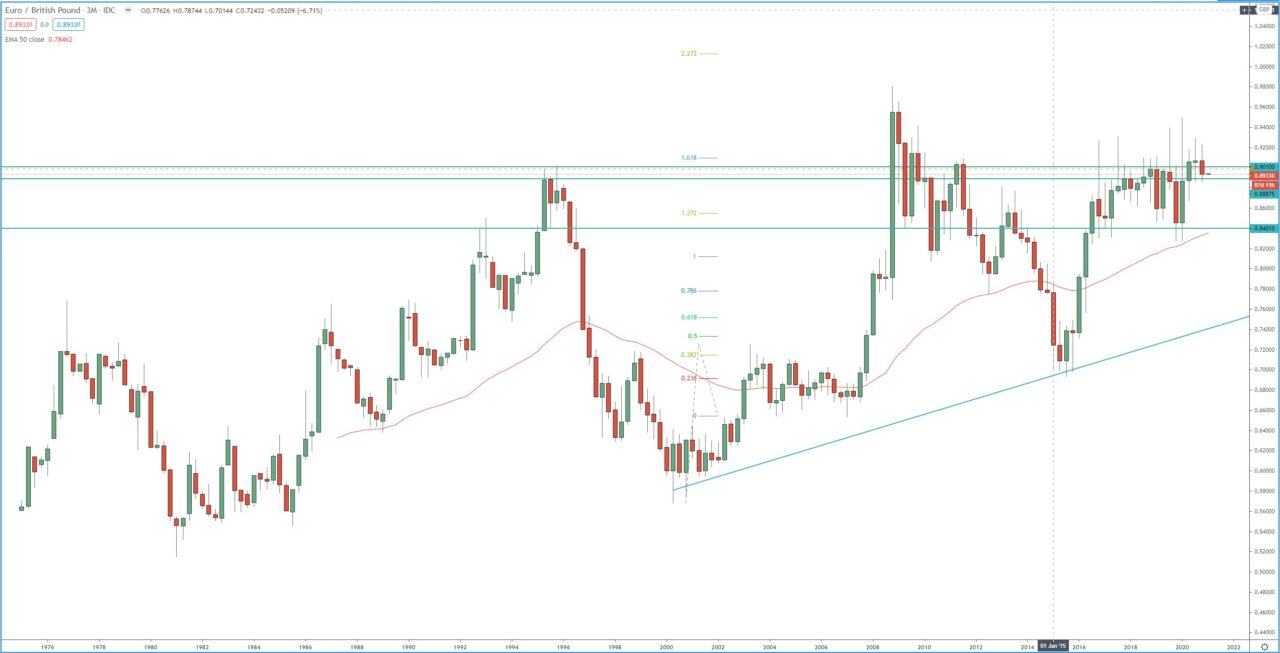
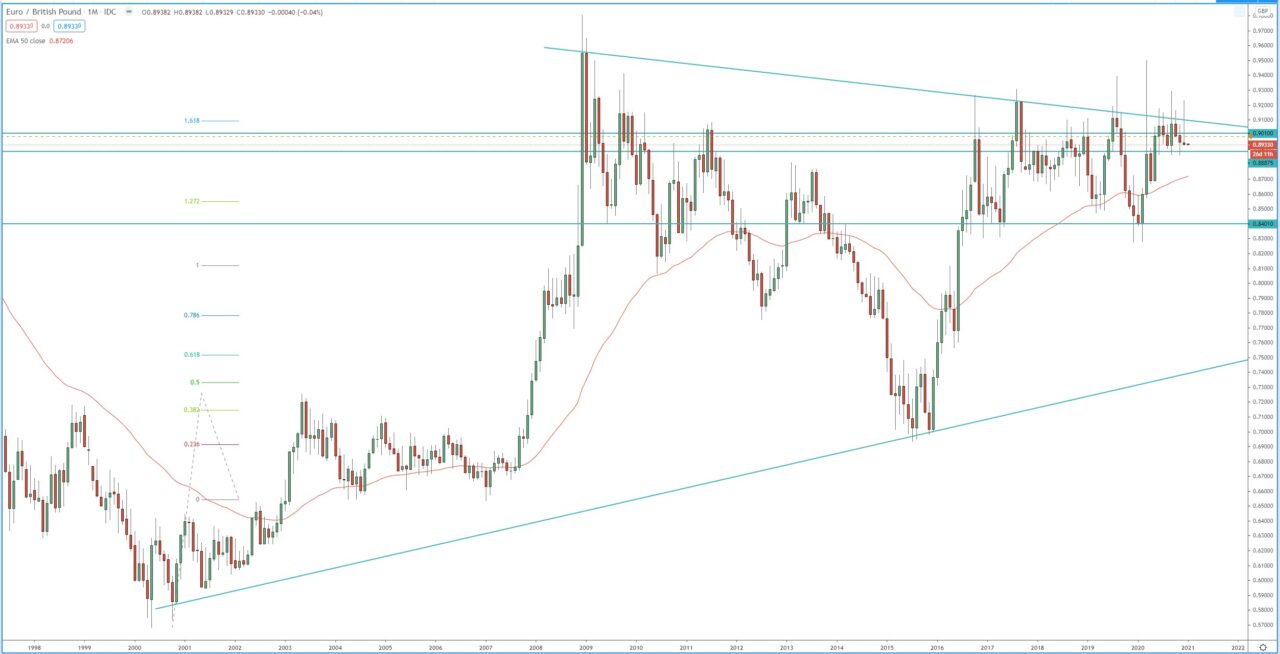
Analysist of the quarterly and the monthly chart are showing multiple attempt and rejection of the extreme high and resistance between 0.9100 -0.9500. The price was not able to hold and trade above the key resistance of 0.9100. The monthly chart closed the month of December 2020 with high test candle, rejecting both horizontal and dynamic resistance signaling potential pullback.
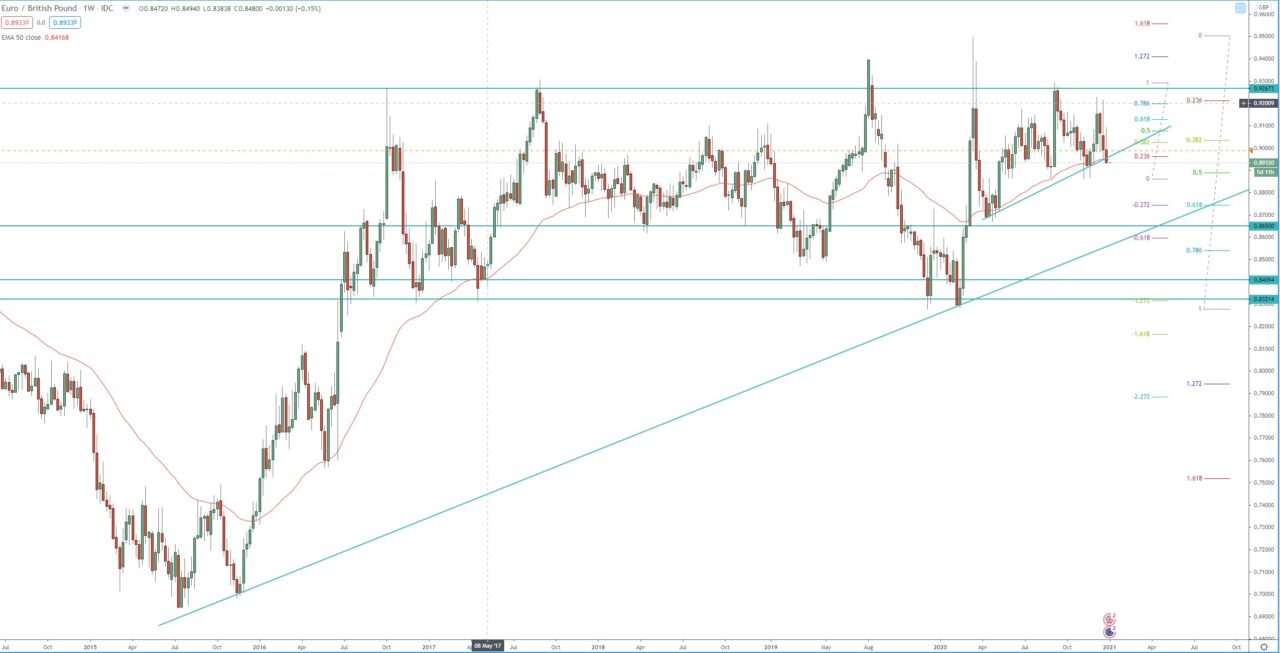
The weekly is breaking below dynamic support and if it breaks below the previous lows, below 0.8900 – 0.8860 we should see further declines toward 0.8600.
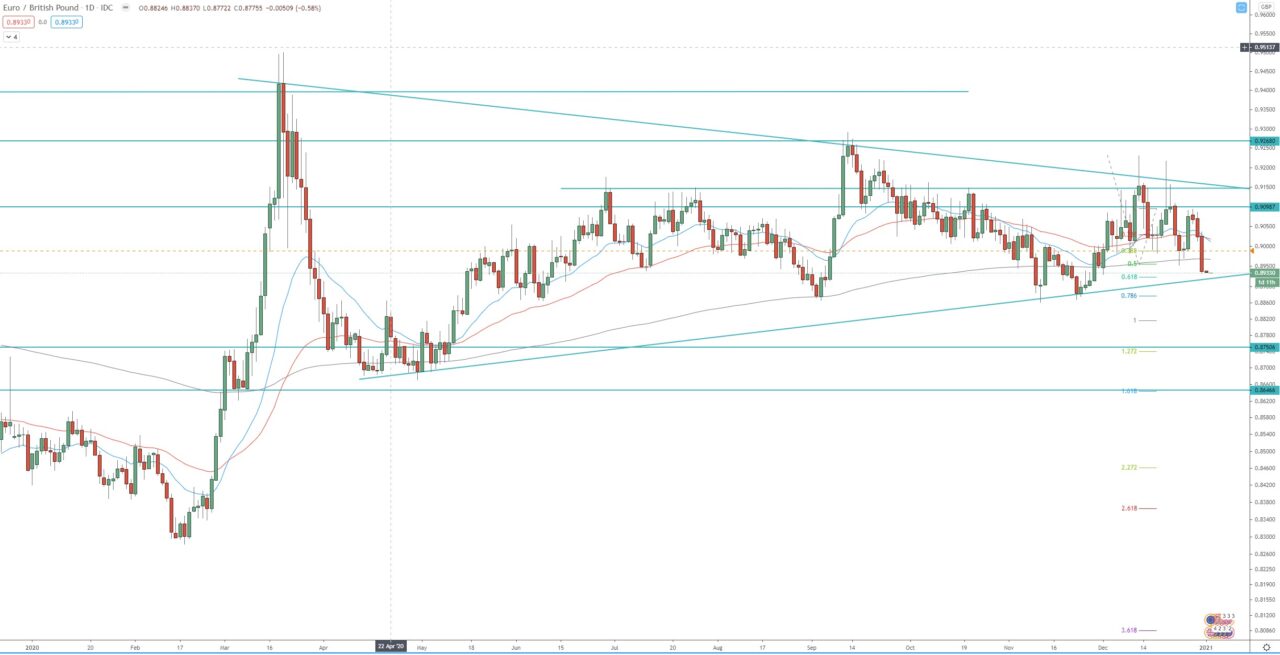
The daily chart has broken to the downside and started the 3rd wave of the bearish run, the first target of this wave is the 1.272 FIB around 0.8750 and second target is 1.618 FIB around 0.8650! The resistance beaten 0.9000 – 0.9080 should be watched for rejection and resumption of the bearish daily trend. This daily wave will be invalidated if the price close above 0.9100.
Quarterly chart:

Monthly chart:

Weekly chart:

Daily chart:


