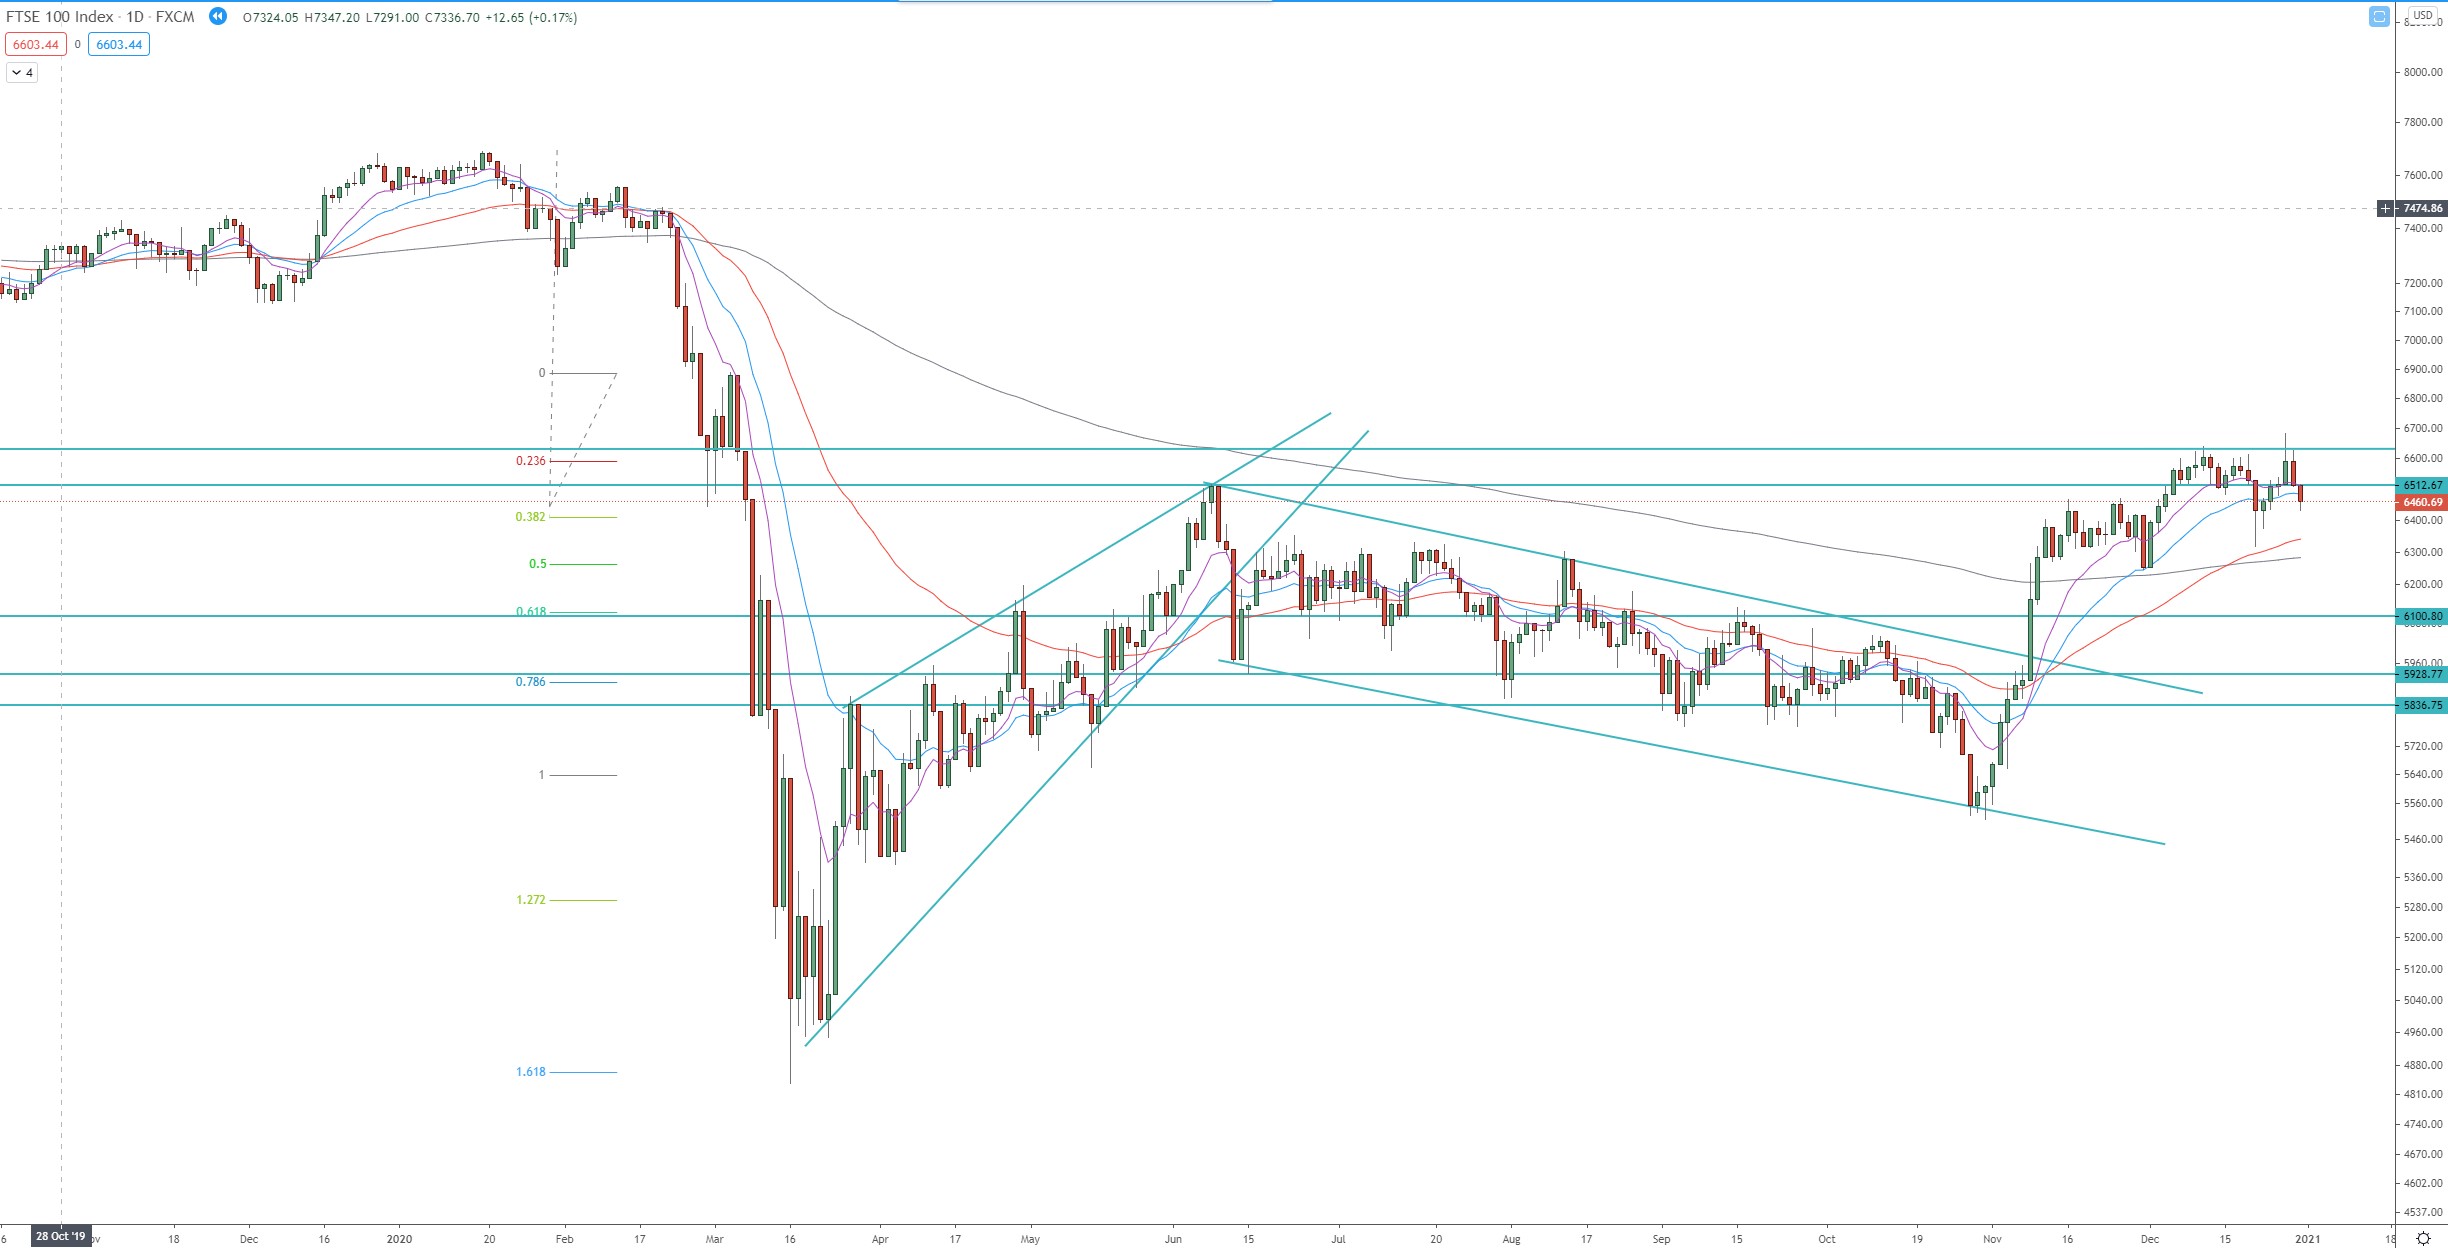
The price is within 3rd bullish wave on the weekly and the daily charts. The first targets of the 3rd bullish daily wave is at 1.272 FIB extension around 6700, and it was almost reached. The second is at 1.618 FIB extension around 7050.
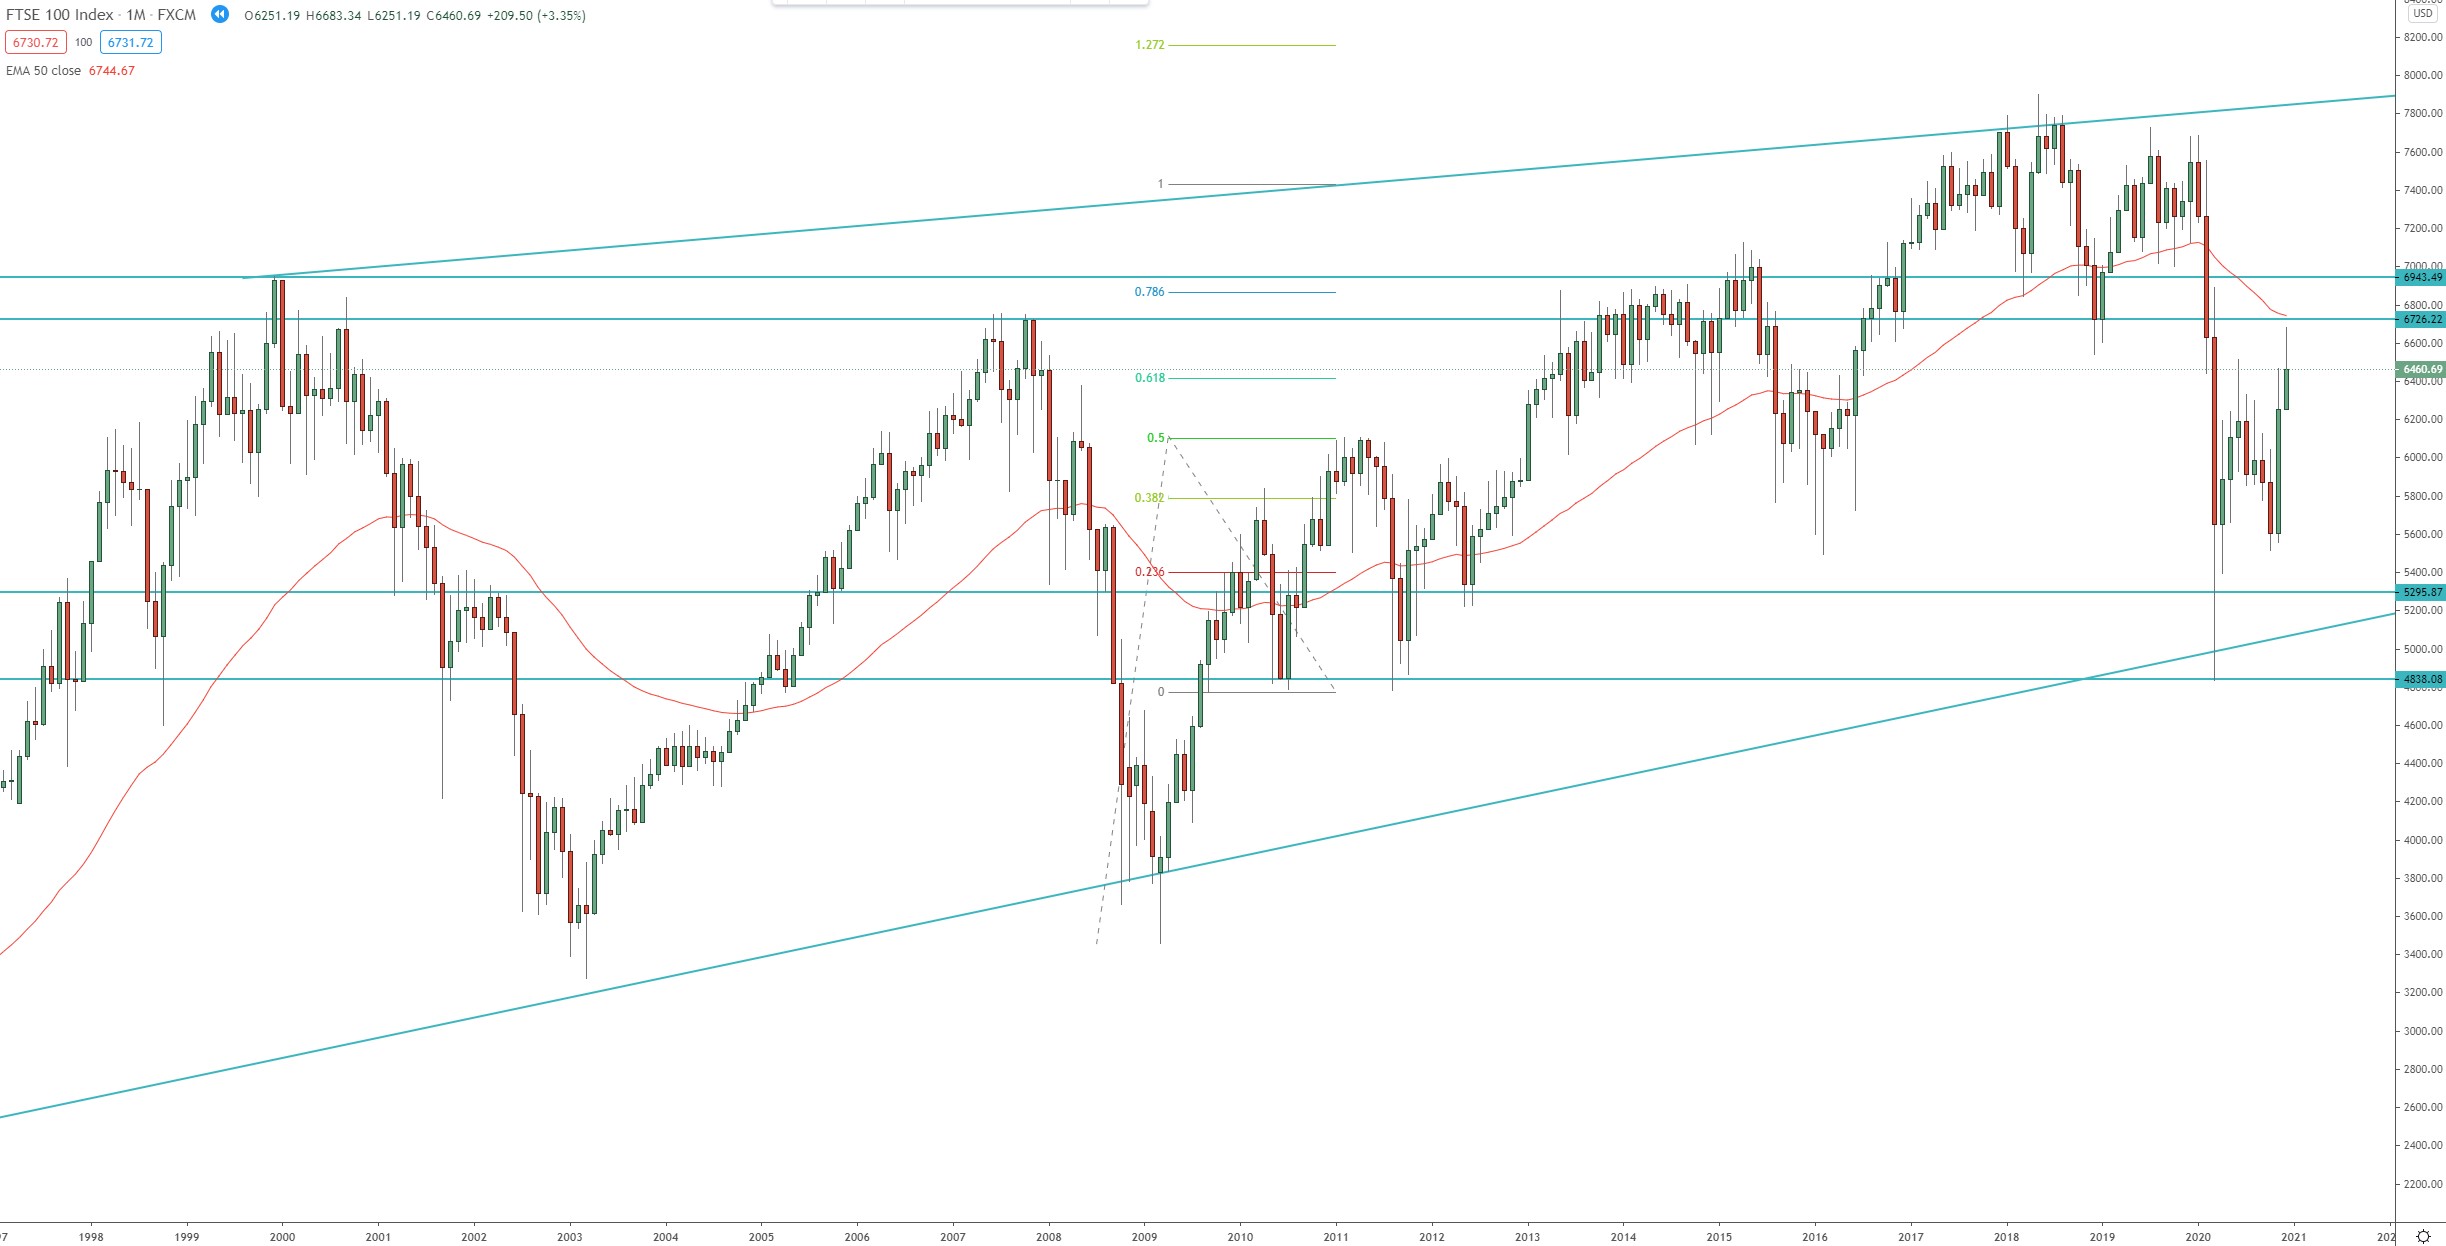
The first target of the 3rd bullish weekly wave is at 1.272 FIB extension around 7650.
The support between 6250 – 6350 should be watched for rejection and resumption of the bullish weekly, daily trend.
Monthly chart:
![UK FTSE 100 monthly chart, technical analysis for investing in the index](https://tradingchartanalysis.com/wp-content/uploads/2021/01/UK-FTSE-100-monthly-chart-2021-1280x652.jpg)
Weekly chart:
![UK FTSE 100 weekly chart, technical analysis for trading the index](https://tradingchartanalysis.com/wp-content/uploads/2021/01/UK-FTSE-100-weekly-chart-2021-1280x652.jpg)
Daily chart:
![UK FTSE 100 daily chart, technical analysis for trading FTSE](https://tradingchartanalysis.com/wp-content/uploads/2021/02/UK-FTSE-100-daily-chart-December-2020-1024x522.jpg)