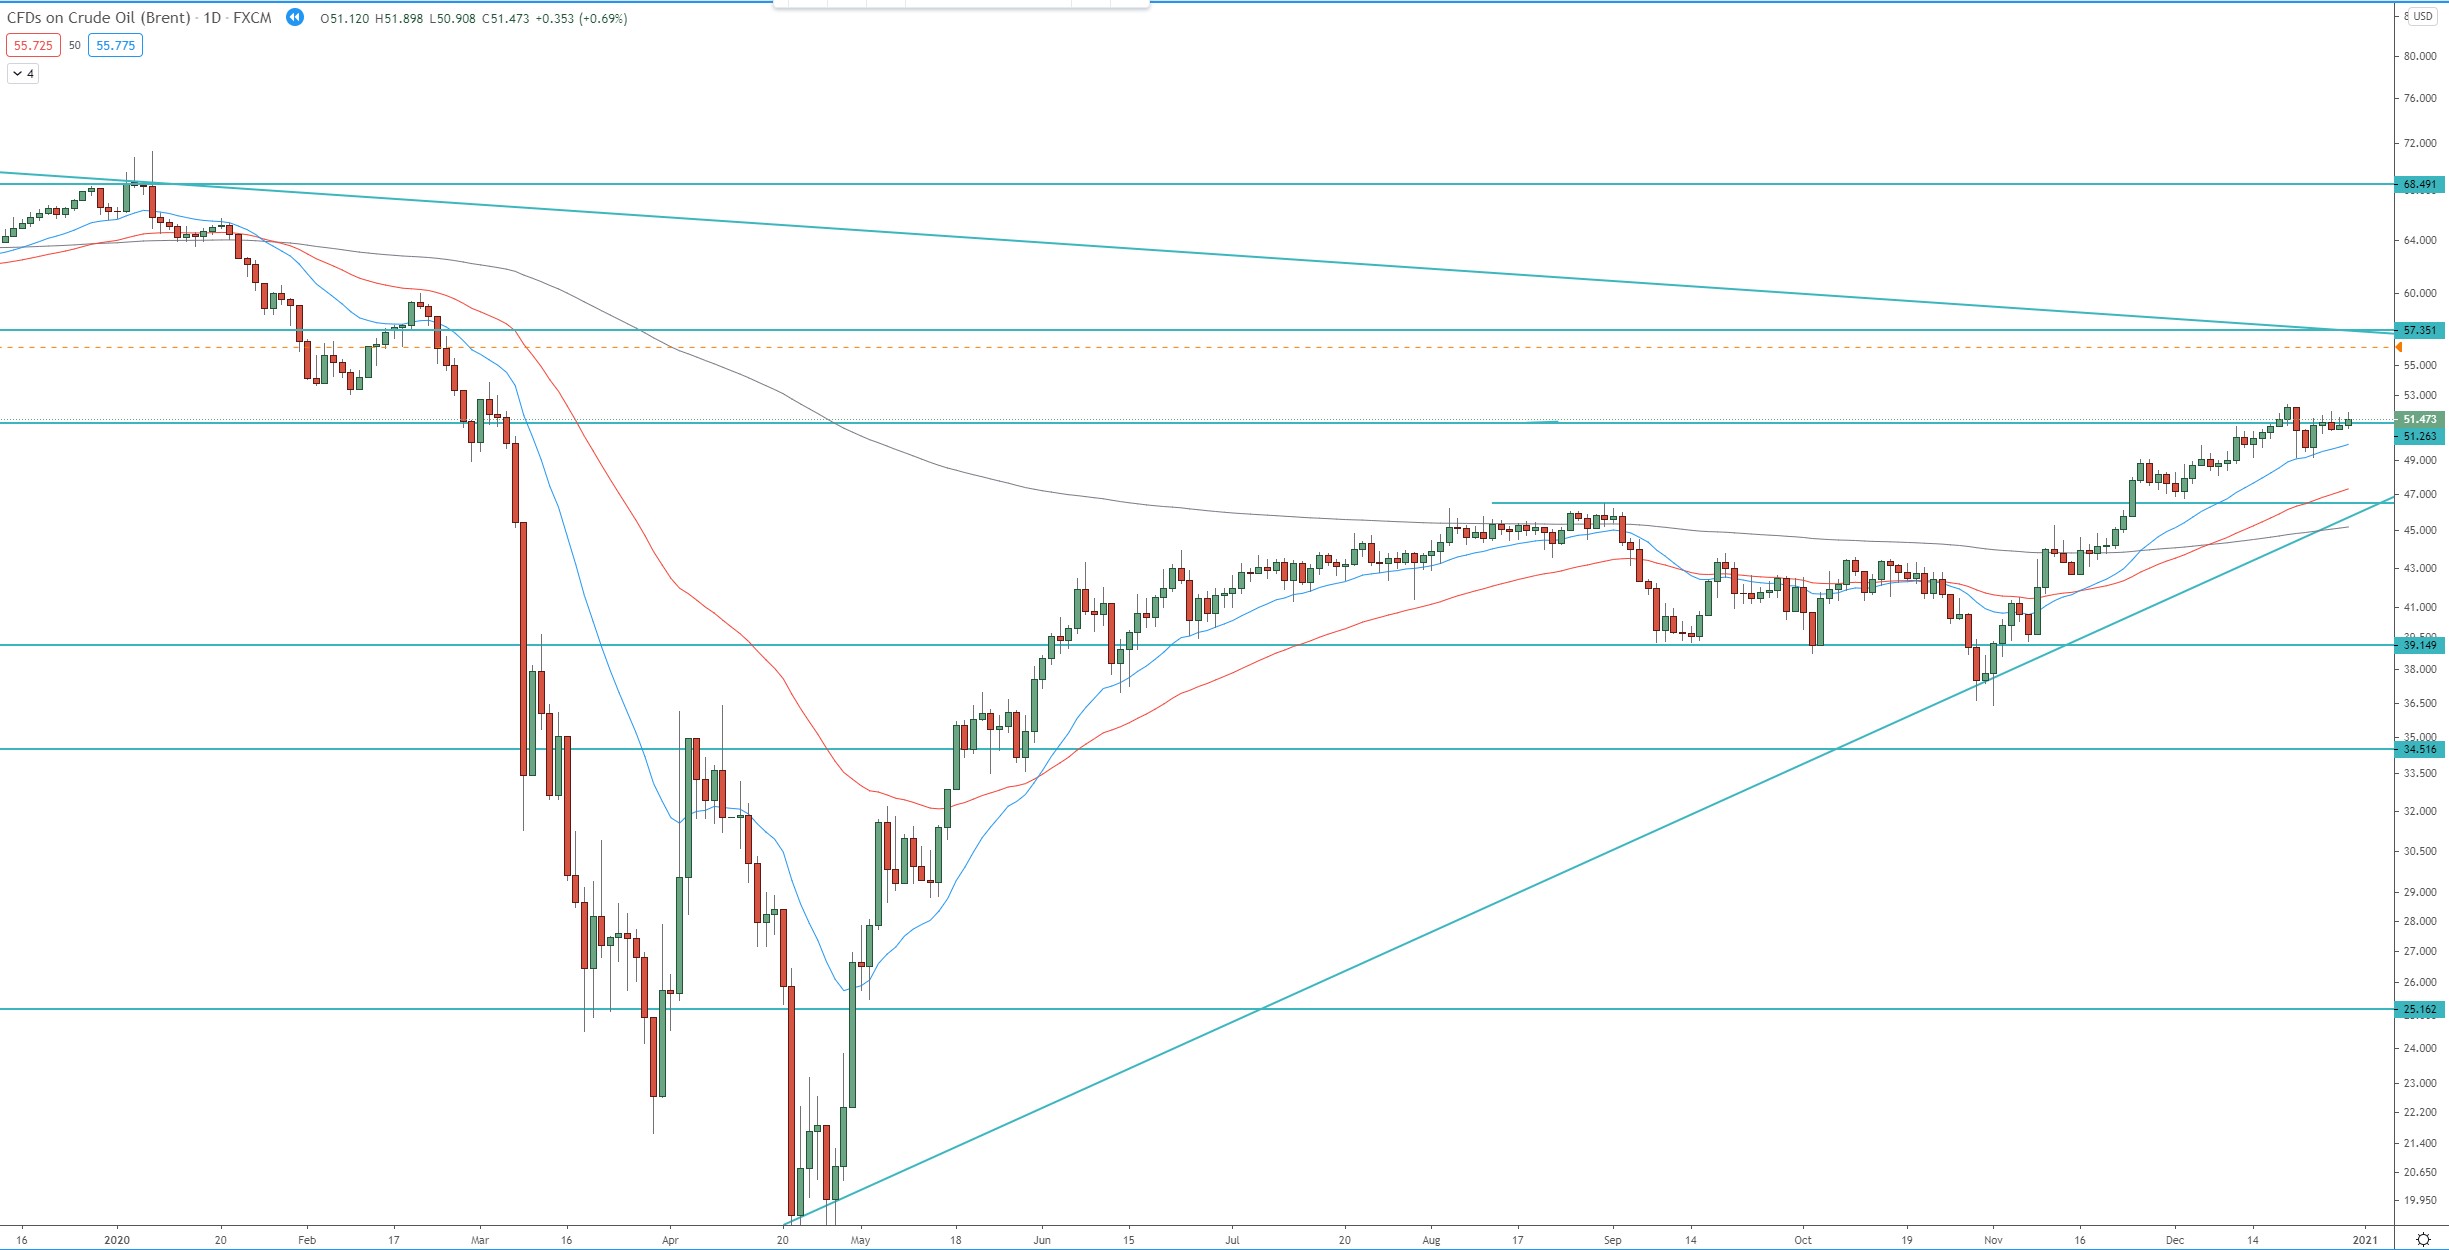
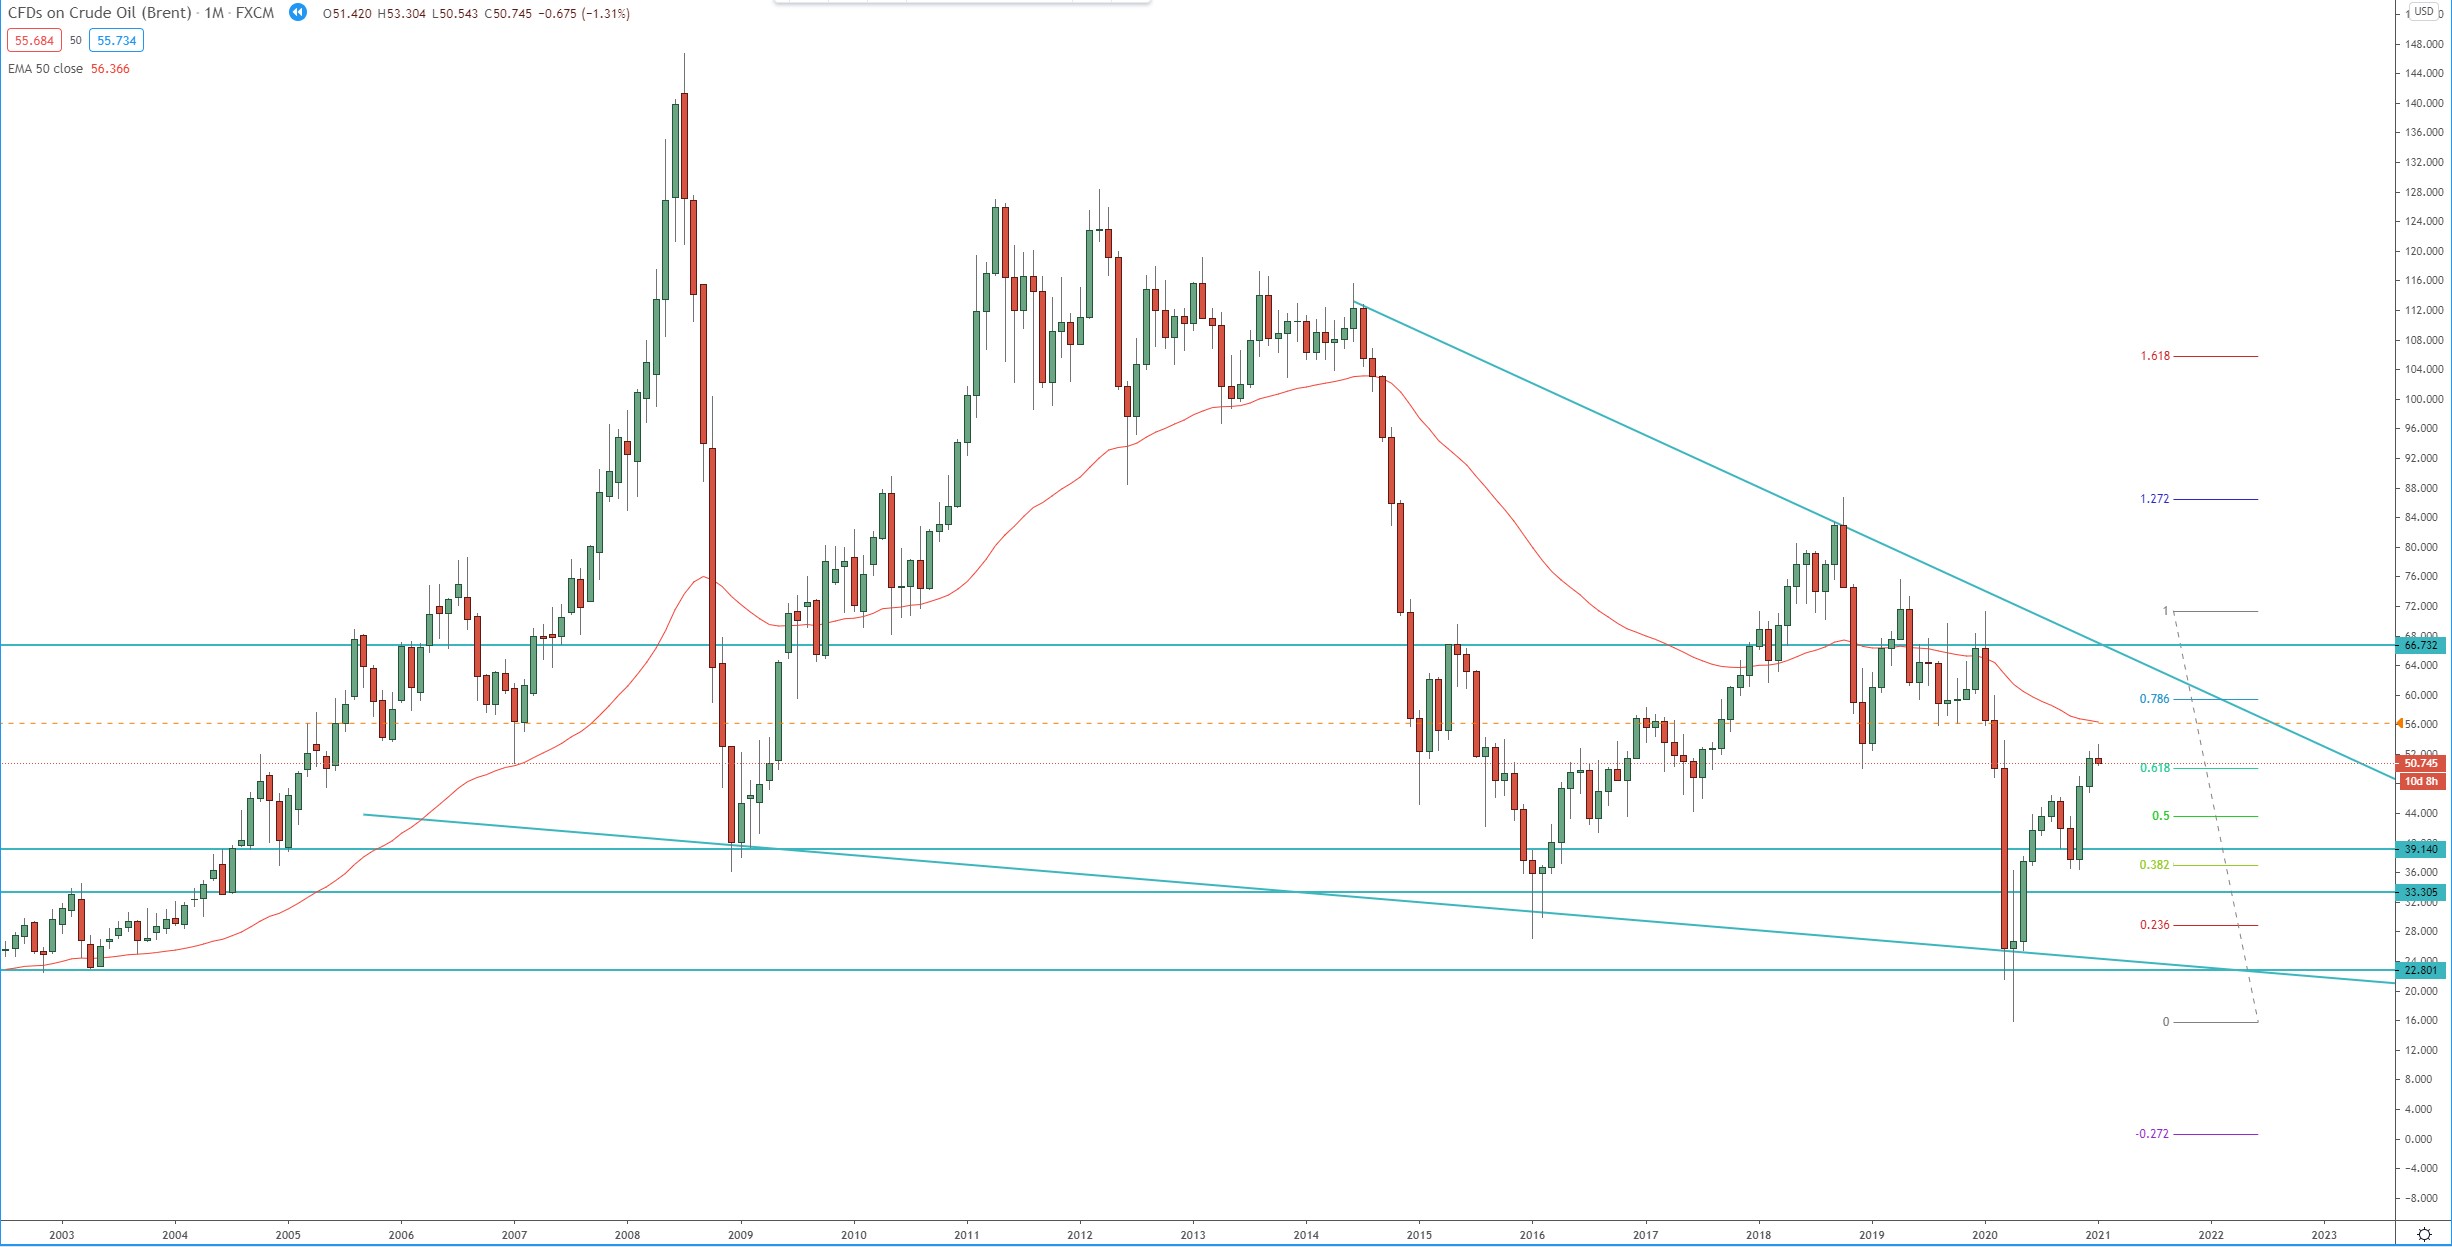
The price is within 3rd bullish wave on the weekly and the daily chart. The 1st target of the 3rd bullish daily wave is at the 1.272 FIB around 60.30, the second target is at 1.618 FIB around 67.70.
If the price pullback toward the support zone between 47.00 – 46.60 we should watch it for rejection and resumption of the bullish weekly, daily trend!
Monthly chart:
Weekly chart:

Daily chart: