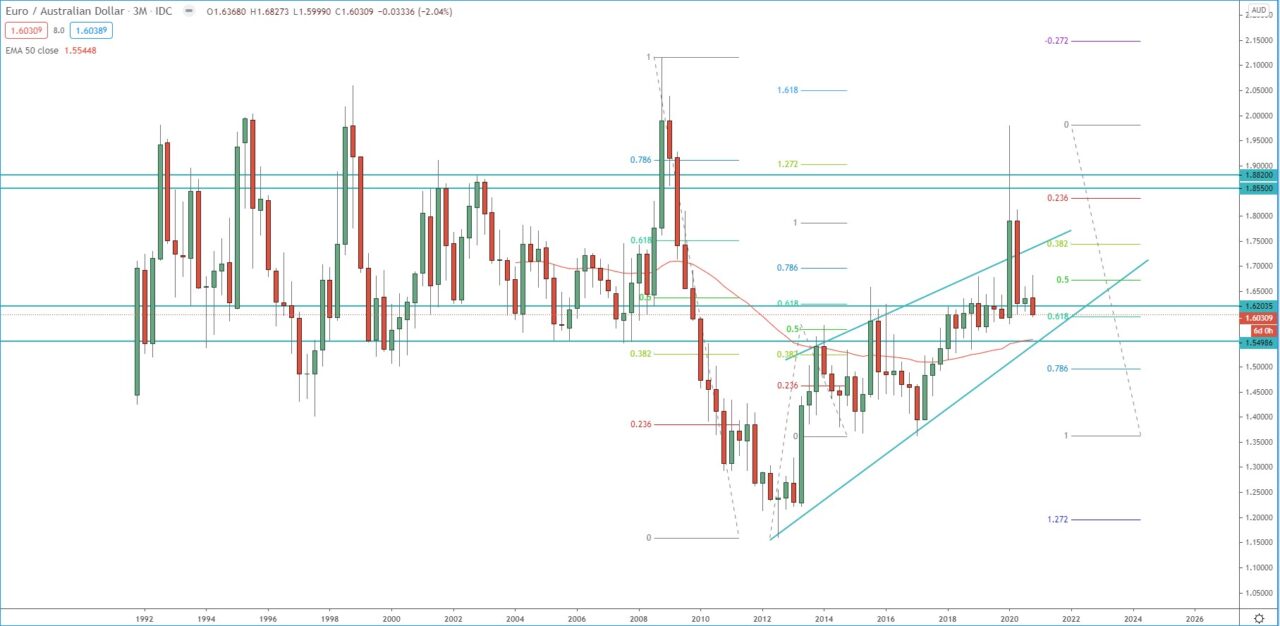
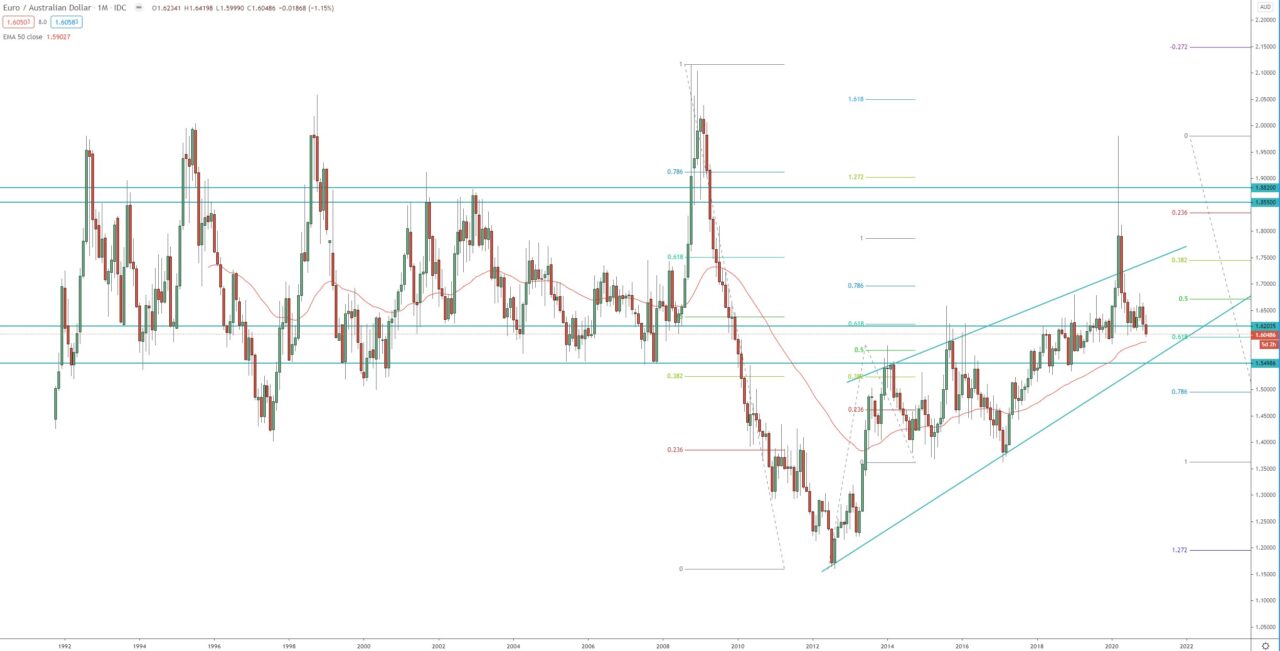
Looking at the quarterly chart we can find the following strong support resistance zone, between 1.6200 – 1.5550, 1.5370 the bottom of that zone.
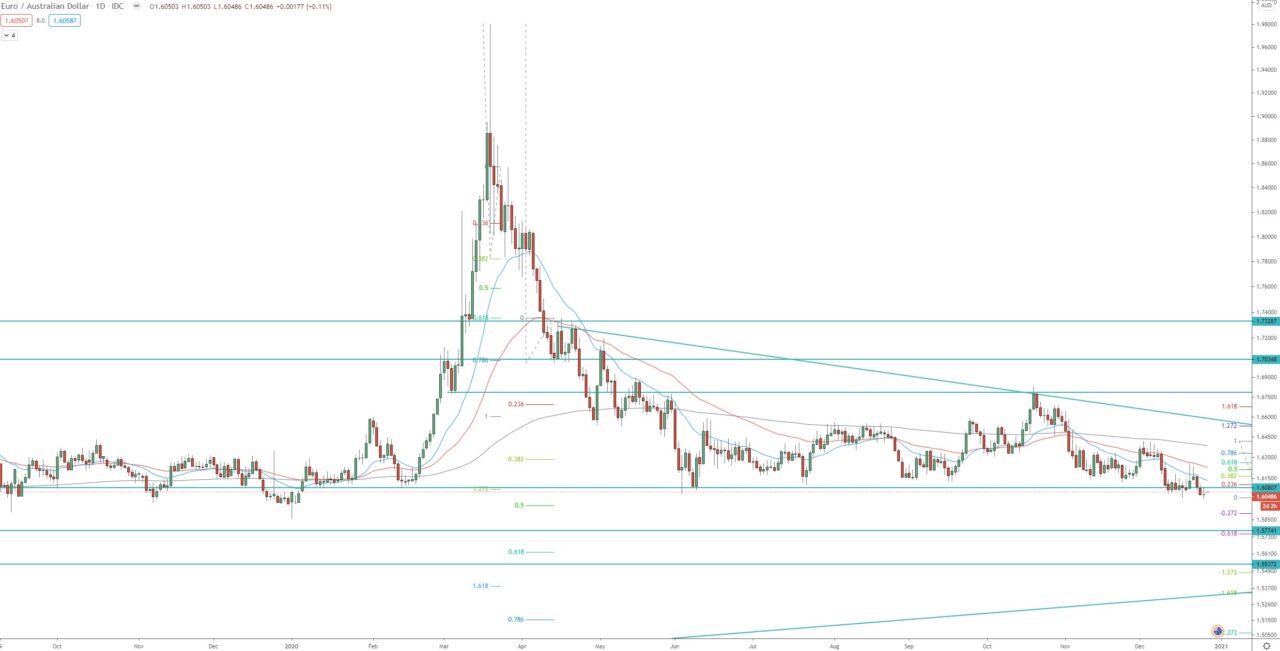
The daily chart is within 3rd wave of the daily bearish trend, the first target of this bearish trend was at 1.272, around 1.6070 was already reached, the second target of that wave is the 1.618 FIB extension at 1.5380.
Resistance levels that should be watched,1.6000 – 1.6130, once support now strong resistance, 1.6200 and dynamic and horizontal resistance between 1.6500 – 1.6550, these should be watched for rejection resumption of the bearish trend toward 1.5550 and 1.5380!
Quarterly char:
Monthly chart:
Daily chart:
