|
Getting your Trinity Audio player ready...
|
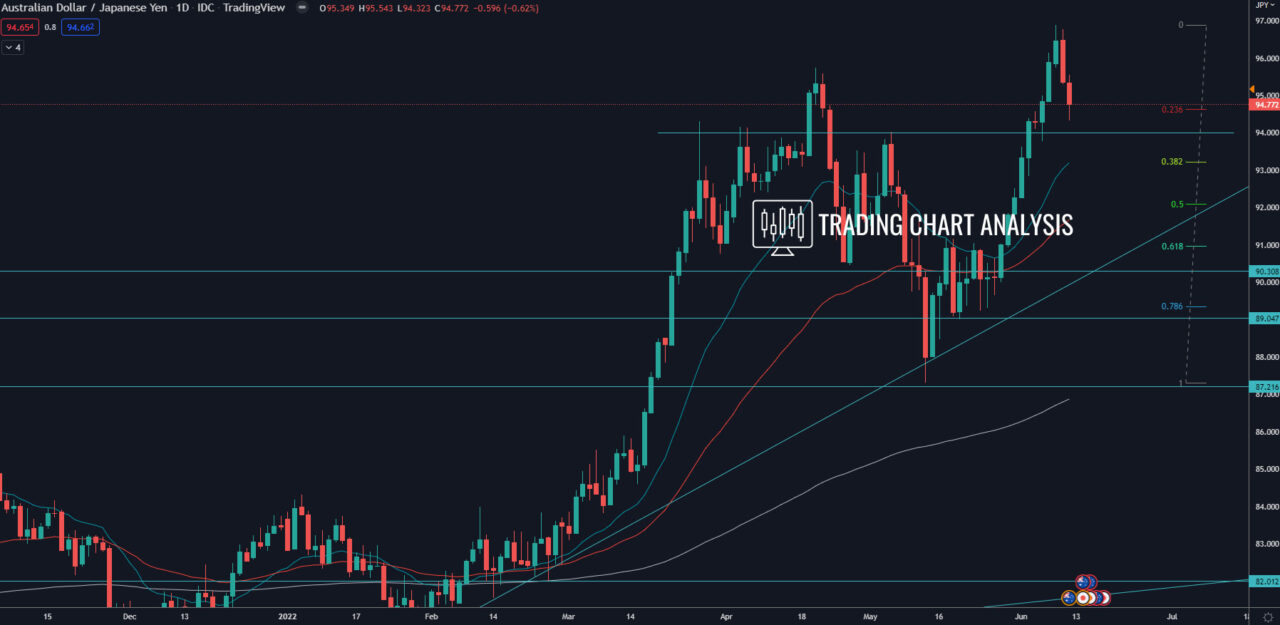
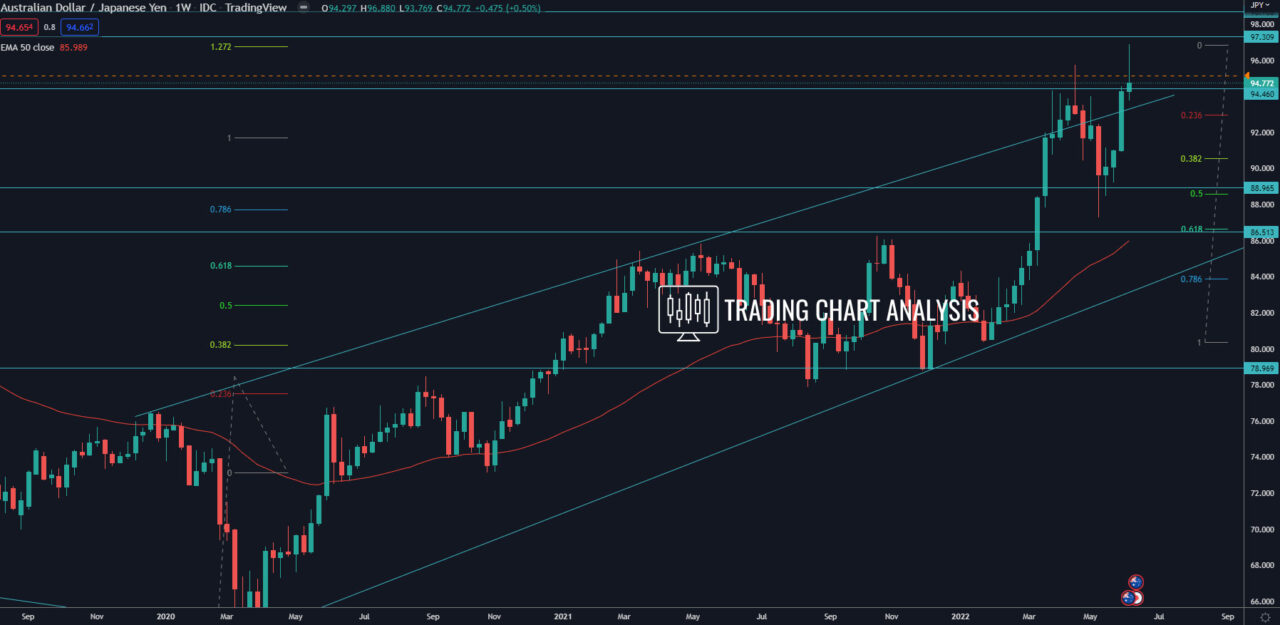
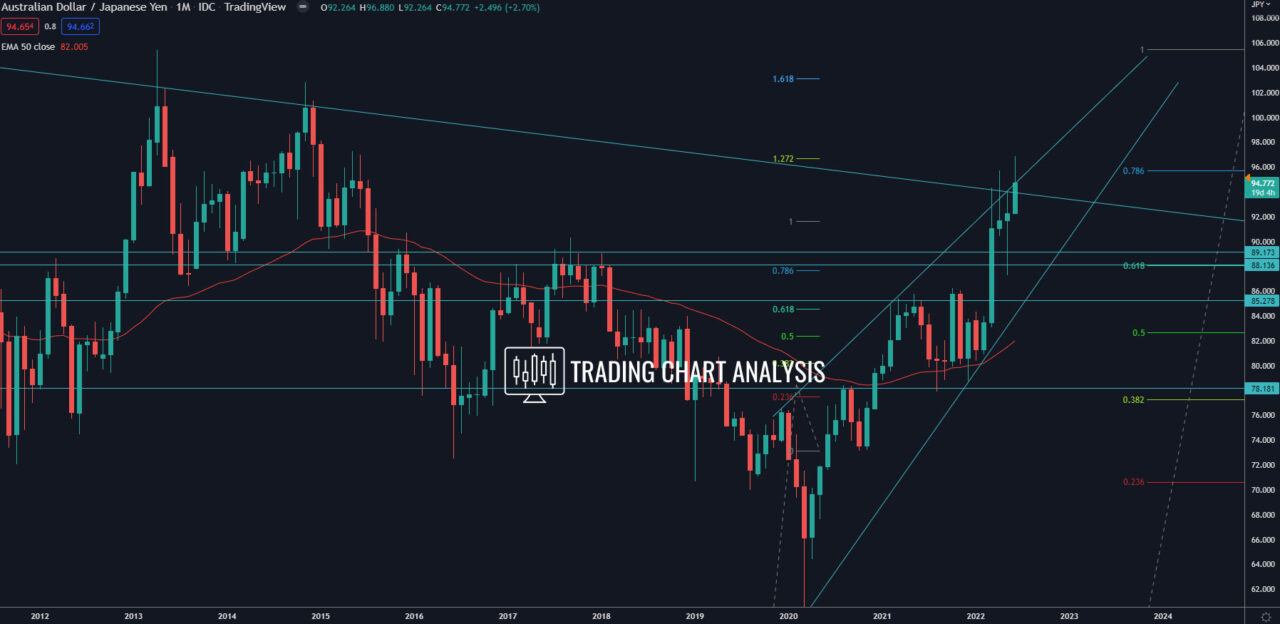
Technical analysis for AUD/JPY, the pair reached the first target for the bullish wave on the monthly chart, the 1.272 FIB extension on the monthly chart at 96.70. The price went as high as 96.88 and rejected it with a high-test candle on the weekly chart, starting a pullback. The first target for this pullback for the AUD/JPY is the support zone on the four-chart between 94.00-93.75. The second target is the 0.382 FIB retracement on the daily chart at 93.25. The third target is the 0.500 FIB retracement on the daily chart at 92.10. And the fourth target for the pullback in the AUD/JPY is the 0.618 FIB retracement on the daily chart at 91.00.
Looking at the bigger picture, AUD/JPY broke above the 2017 high at 90.30, which opened the door for a bullish run toward the 2014 high at 102.84. Also, the 1.618 FIB extension on the monthly chart at 103.10 is the second target of the bullish wave on the monthly chart.
Daily chart:

Weekly chart:

Monthly chart:


