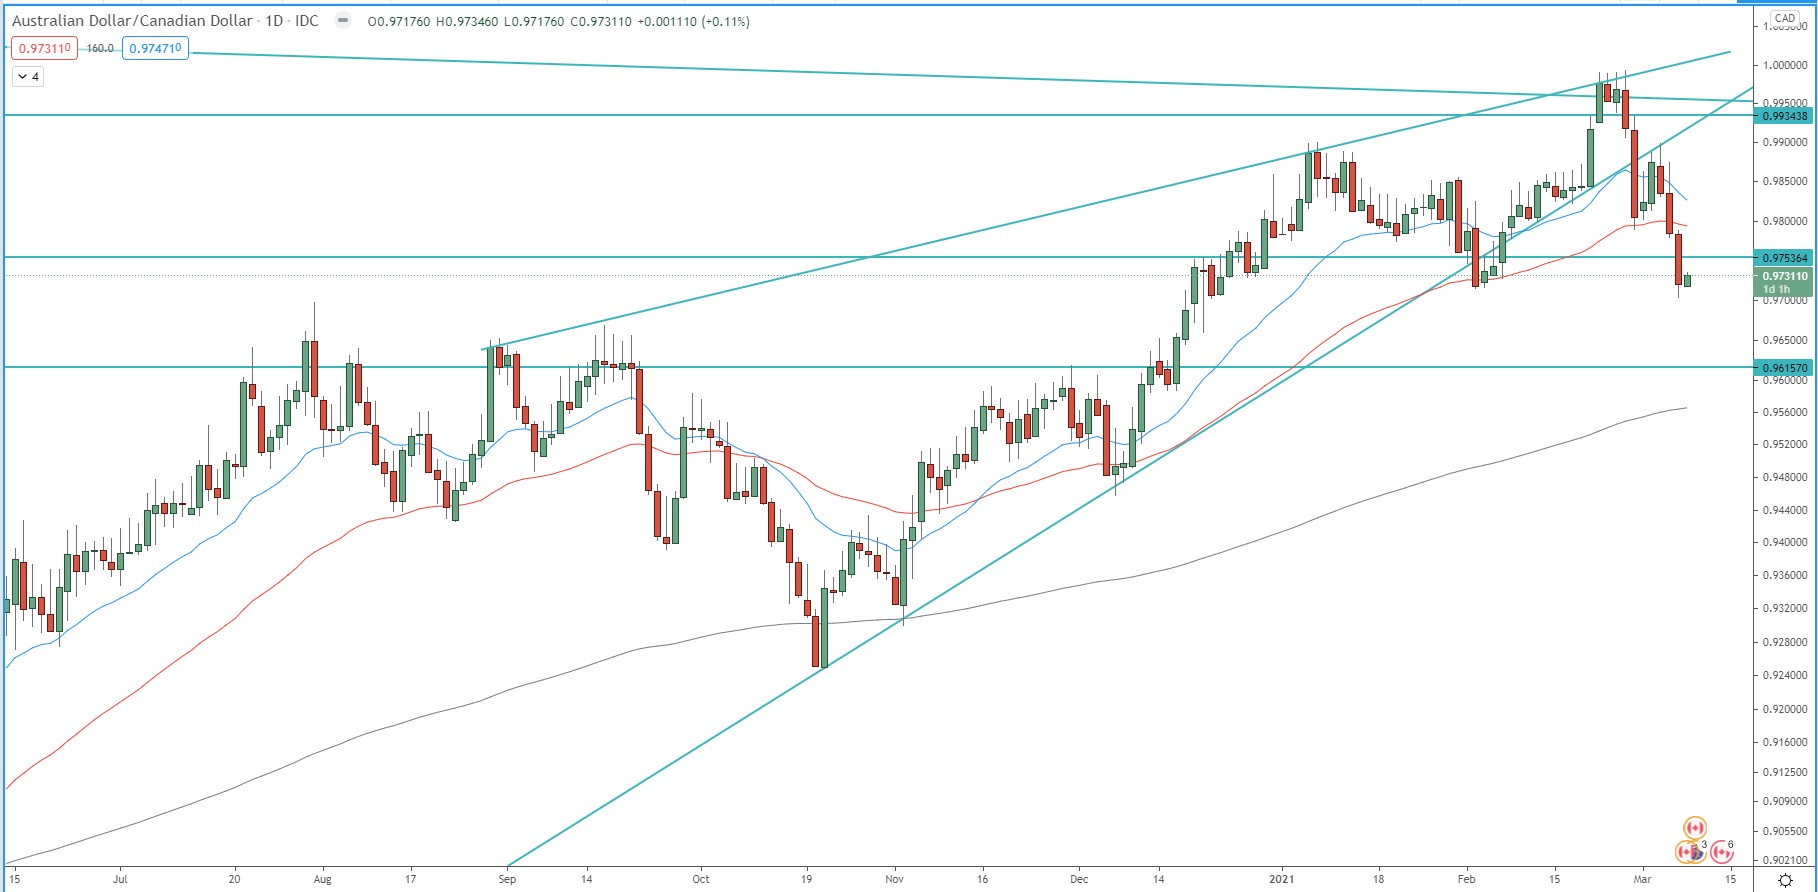
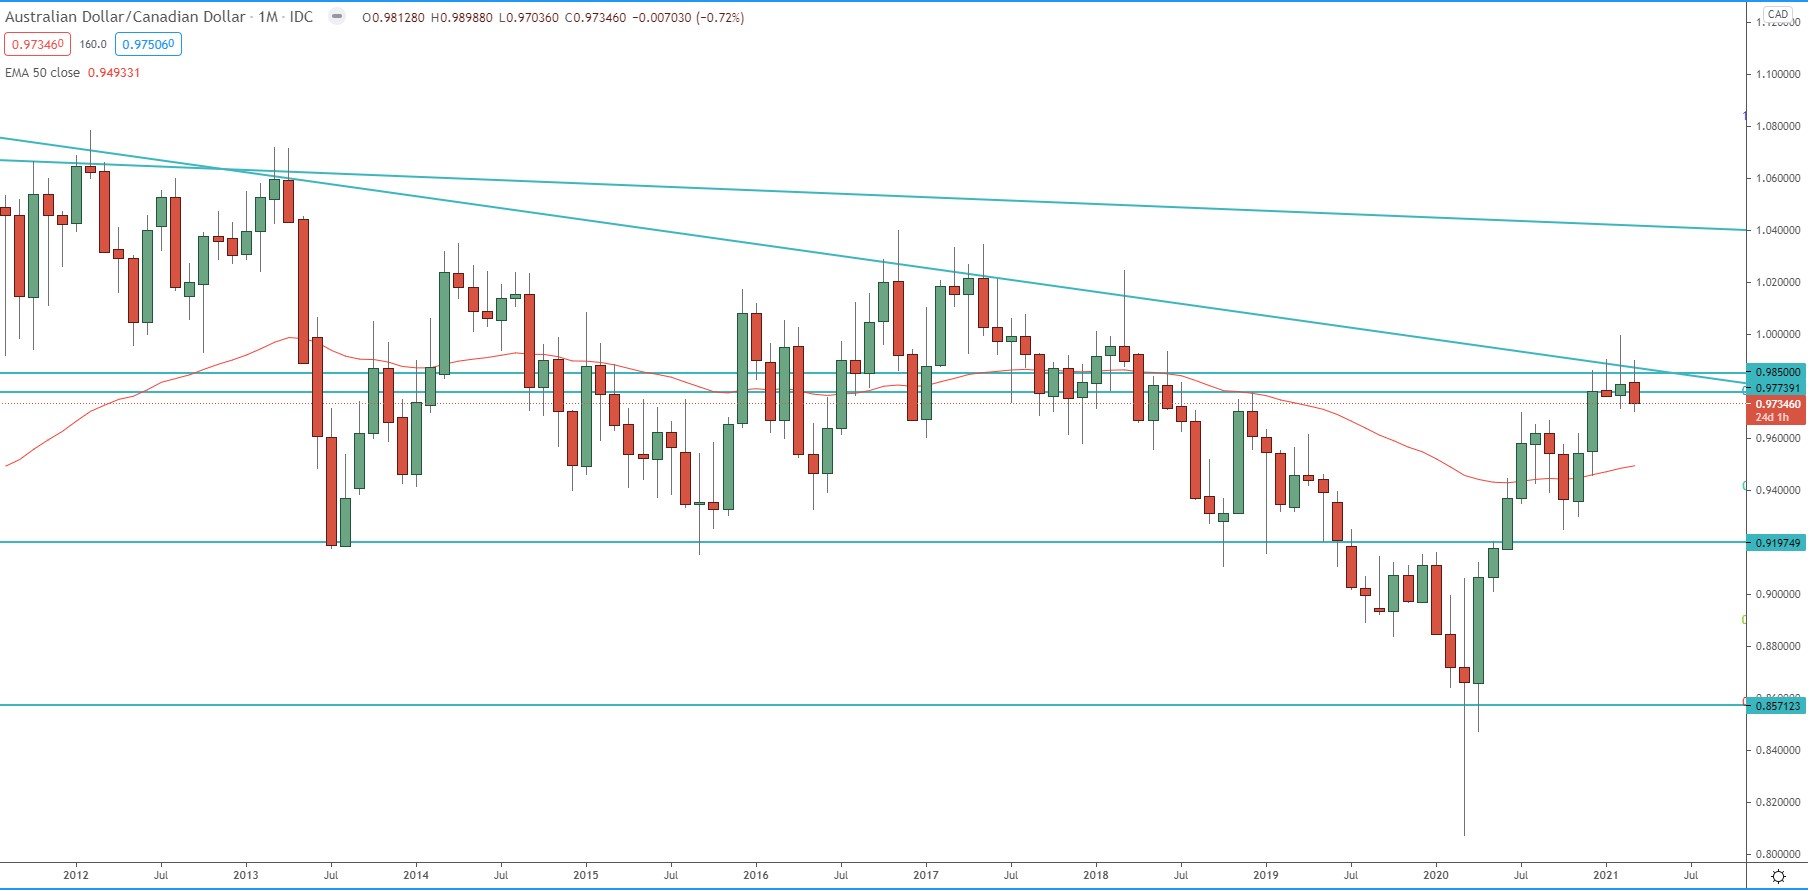
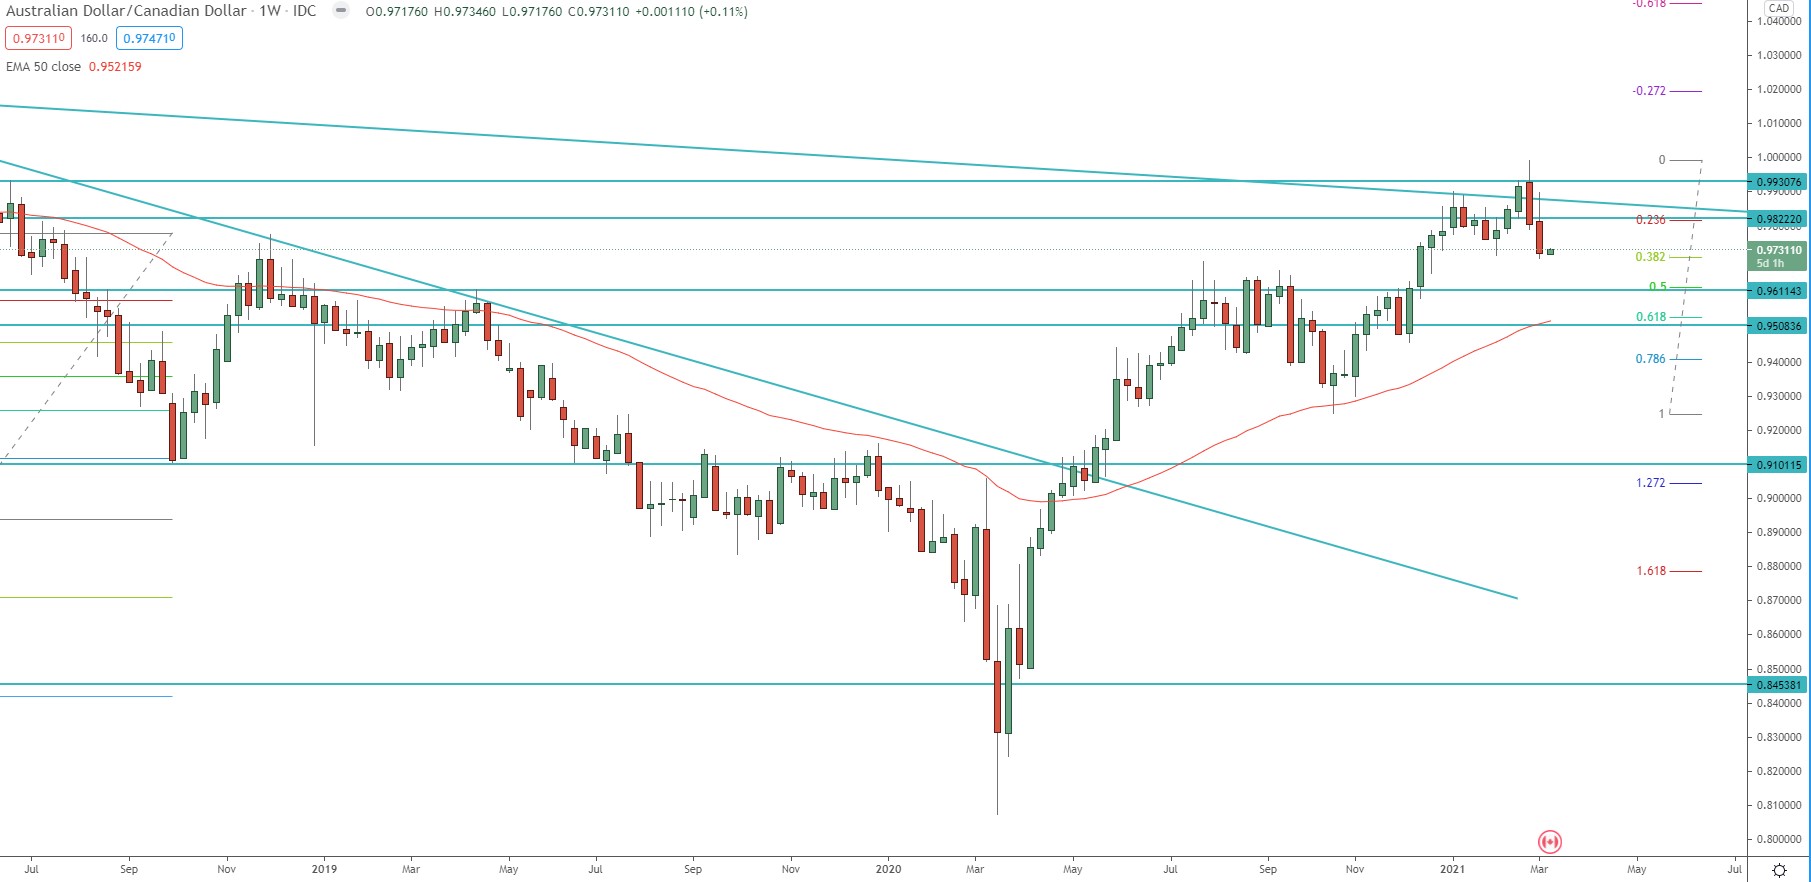
The pair closed with another high-test candle on the monthly chart, forming tweezer tops. On the weekly chart, the price breaks below the previous weekly closing low, a hint for a potential further decline. However, the daily is sitting at the previous low, and if the price break below that low, it will accelerate this decline. toward, first 1.272 FIB extension around 0.9640, second target at 1.618 FIB extension around 0.9570.
On the other hand, if the price breaks above 0.9900, it will invalidate this bearish view and send the price back toward the 1.00 level.
Monthly chart:
Weekly chart:
Daily chart: