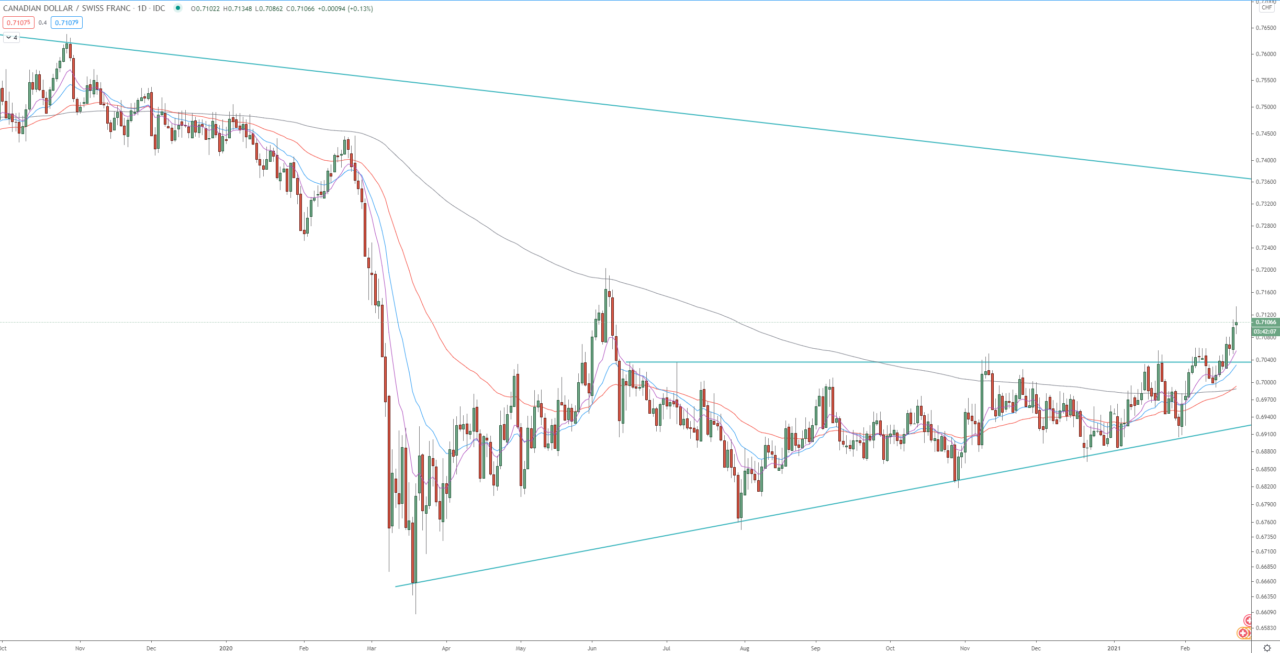
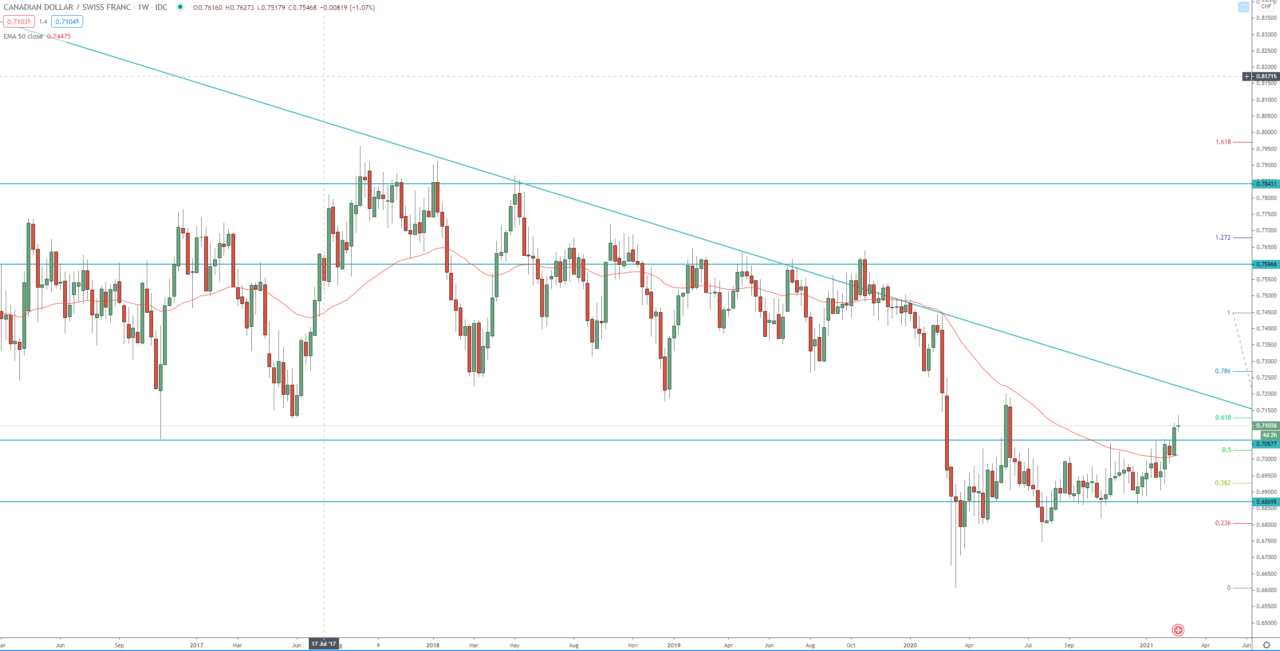
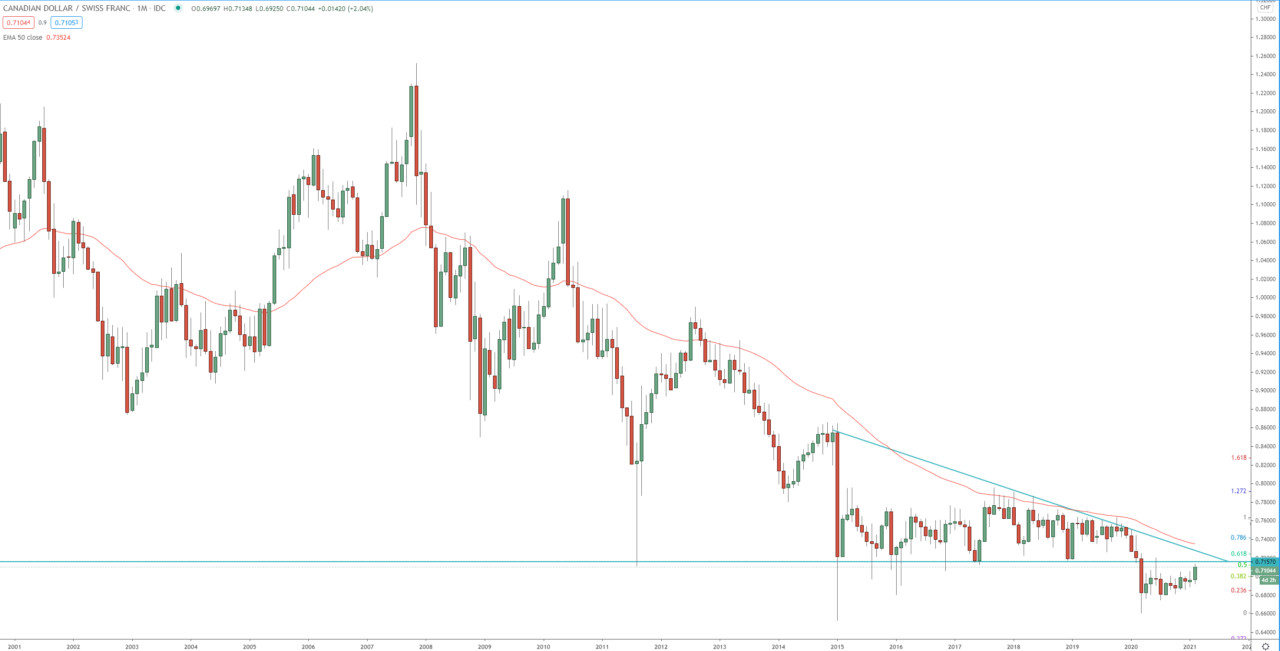
Last week the price broke above a resistance zone which has been holding the bulls since June 2020, the breakout was on both the weekly and the daily chart. The first target of this breakout is the previous daily high around 0.7200, if the price break above that and above the dynamic resistance (descending trend line on the monthly weekly charts) next target for this bullish run is at 1.272 FIB extension around 0.7500, break above that will send the price toward 1.618 FIB extension around 0.7700.
The support zone between 0.7000 – 0.7050 should be watched in case of pullback for rejection and resumption of the weekly, daily bullish run.
Daily chart:

Weekly chart:

Monthly chart:


