|
Getting your Trinity Audio player ready...
|
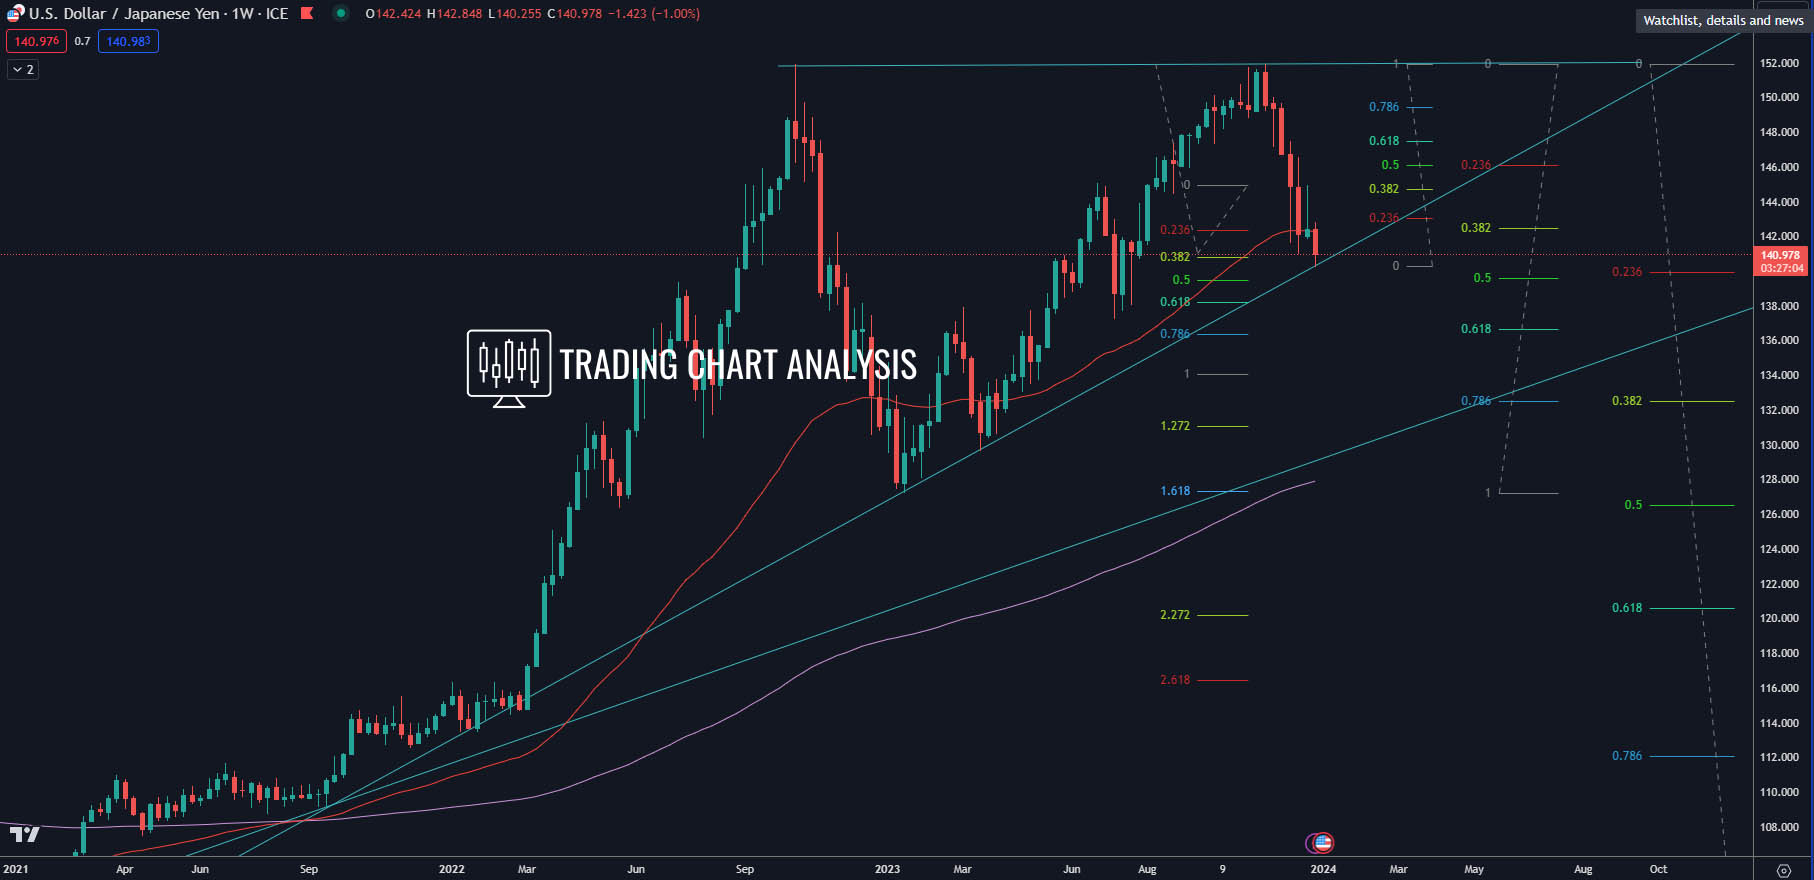
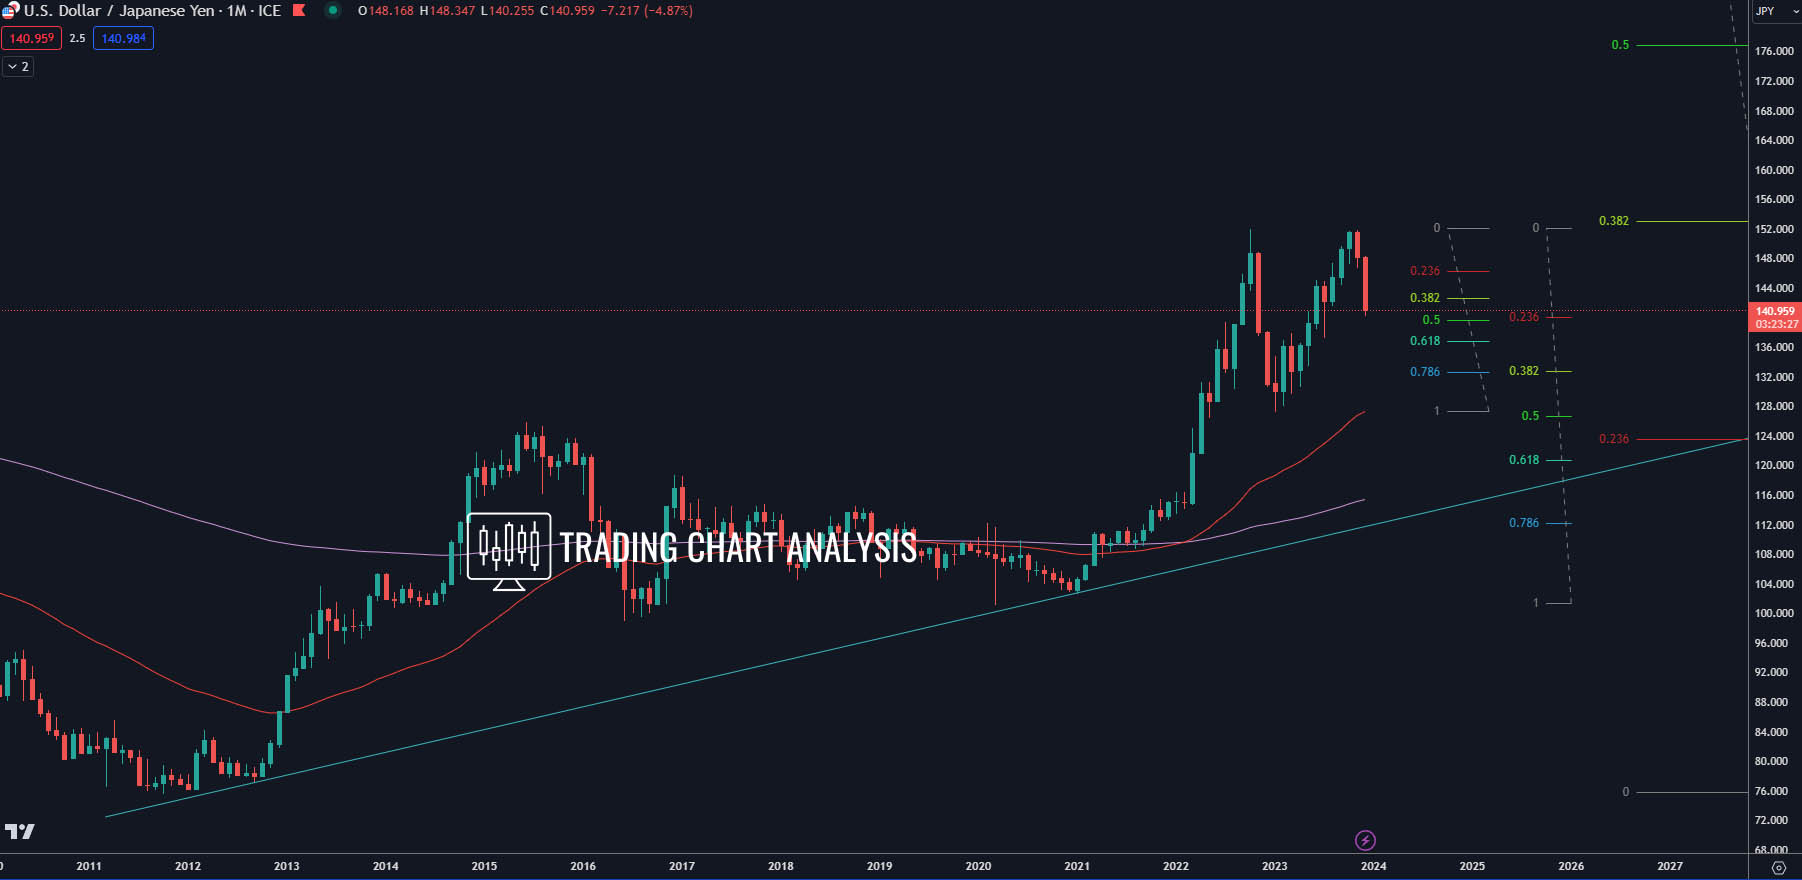
In our USD/JPY technical analysis, a significant development unfolds as the pair forms double top on both the weekly and monthly charts, triggering a retracement. Delving into the intricacies, we explore key targets and potential scenarios for informed trading decisions.
Bearish Momentum: Targets for Retracement
- Primary Target: 0.382 FIB Retracement (Weekly) – 142.45 The initial phase of the retracement sets its sights on the 0.382 Fibonacci retracement on the weekly chart, strategically positioned at 142.45. This level has already been reached.
- Secondary Target: 0.618 FIB Retracement (Weekly) – 136.65 Advancing further, the second target is the 0.618 Fibonacci retracement on the weekly chart, identified at 136.65.
- Tertiary Target: 0.786 FIB Retracement (Weekly) / 0.382 FIB Retracement (Monthly) – 132.70 The third target aligns with the 0.786 Fibonacci retracement on the weekly chart, corresponding to a 0.382 Fibonacci retracement on the monthly chart, situated around 132.70.
- Quaternary Target: Previous Monthly Low – 127.22 The fourth target is set at the previous monthly low of 127.22, representing a 1.618 Fibonacci extension on the weekly chart and slightly above the 0.500 Fibonacci retracement on the monthly chart.
Potential Bounce Levels: Upside Considerations
- Primary Bounce Level: 0.382 FIB Retracement (Weekly/Daily) – 144.70 In the event of a bounce, key levels to monitor include the 0.382 Fibonacci retracement on both the weekly and daily charts, positioned at 144.70.
- Secondary Bounce Level: 0.618 FIB Retracement (Weekly/Daily) – 147.50 Further upward, the 0.618 Fibonacci retracement on both the weekly and daily charts stands out as a potential bounce level, located at 147.50.
Bullish Potential: Breaking Above Double Top
- Bullish Breakout Signal: Above Double Top – 151.94 A break above the double top on both the weekly and monthly charts, notably above 151.94, signals the potential initiation of a bullish run.
- Bullish Targets: 0.500 FIB Retracement (Monthly) – 177.00 If the bullish momentum prevails, the first target is set at the 0.500 Fibonacci retracement on the monthly chart, positioned at 177.00.
As we navigate the dynamics of USD/JPY, understanding these critical levels and potential breakout points provides traders with valuable insights for strategic decision-making in the evolving currency market.
Weekly chart:

Monthly chart:


