|
Getting your Trinity Audio player ready...
|
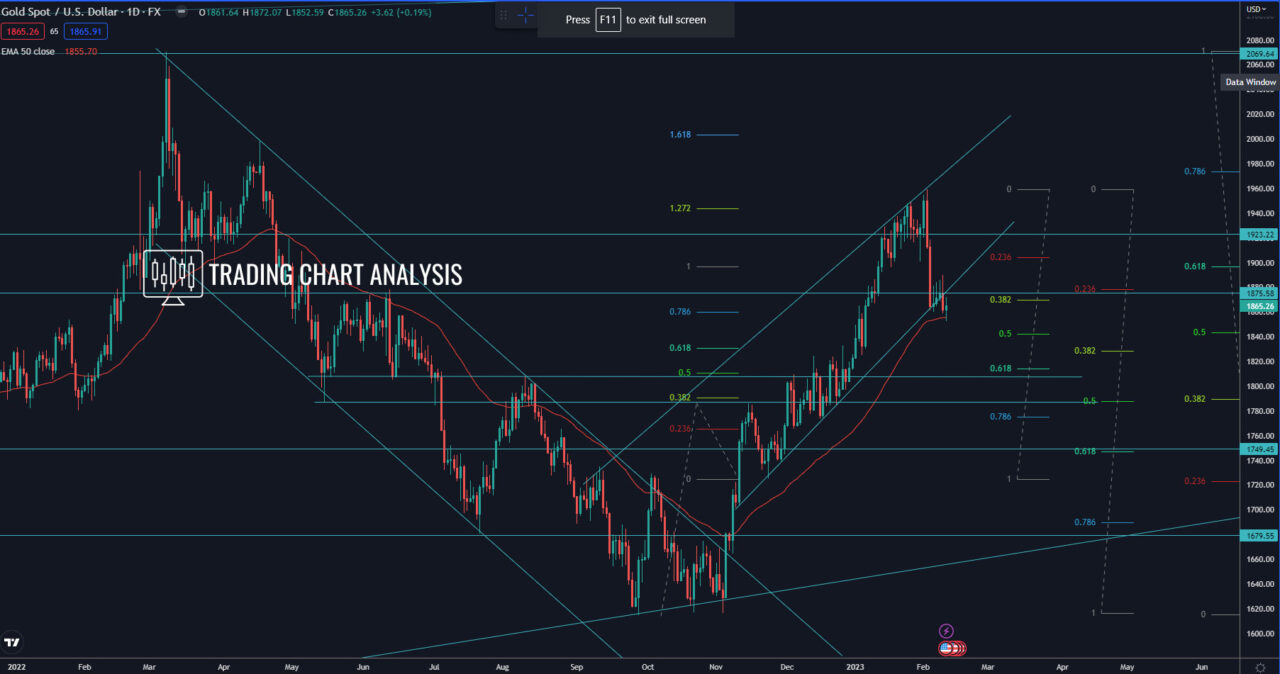
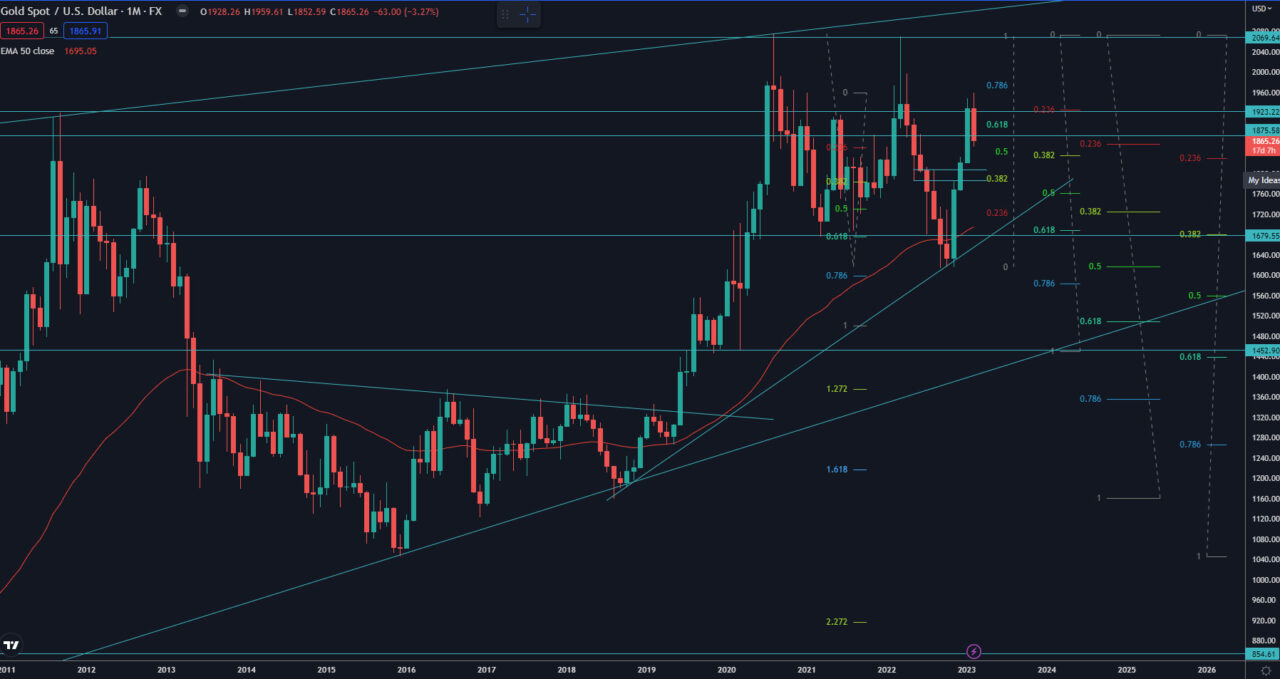
Gold Technical Analysis, the price formed a double bottom on the weekly chart, bounced from the 0.500 FIB retracement on the monthly chart at 1615$, and started a pullback. This pullback turned to a full breakout on the weekly and the daily chart, which sent the price of Gold soaring more than 20% higher. The first target of this breakout on the daily chart, the 1.272 FIB extension at 1945$, was reached. The price of XAU went as high as 1959$. The second target, in case the price break above 1959$, is the 1.618 FIB extension on the daily chart at 2003$. The third target is the previous all-time high at 2074$. And if the price of Gold breaks above the previous all-time high and doubles tops at 2074$, that will send the Gold higher, toward a 2.272 FIB extension and 2.618 FIB extension on the daily chart at 2114$ and 2175$, respectively. The fifth target in this bullish scenario is the 2.272 FIB extension of the bullish wave on the monthly chart at 2450$.
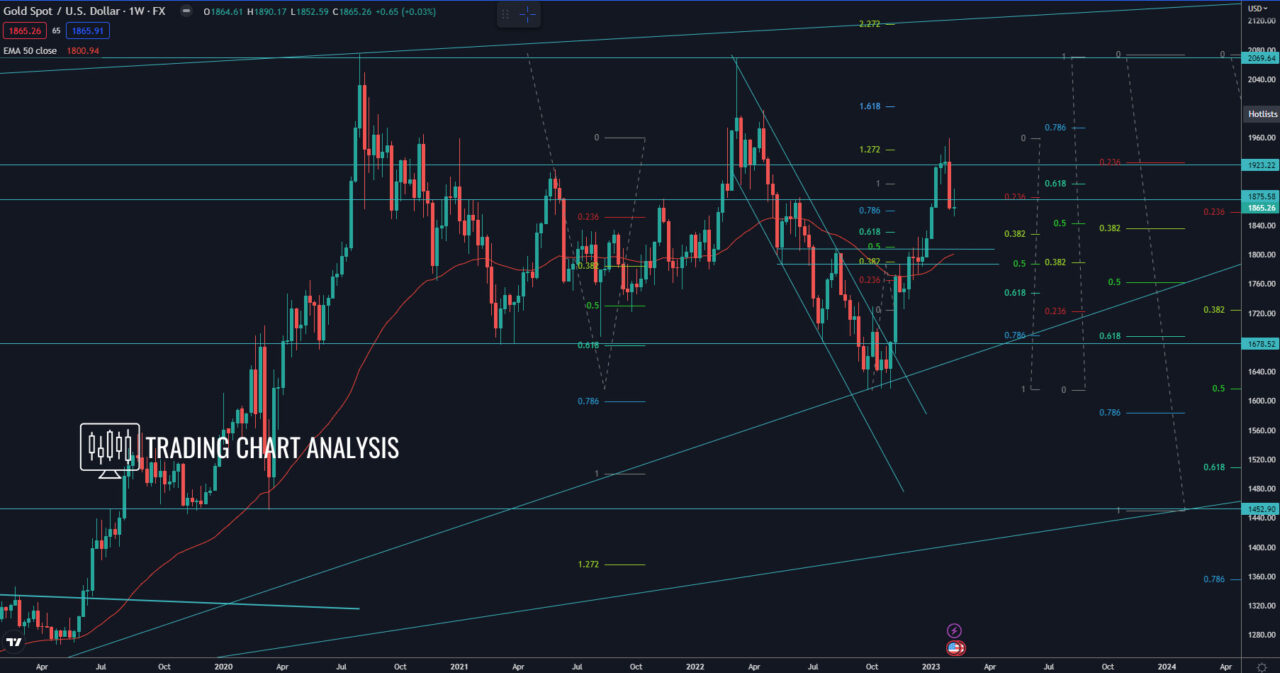
Currently, the price of Gold started a pullback on the daily and weekly charts. The first target for this pullback is the 0.382 FIB retracement on the weekly chart at 1828$. The second target is the 0.618 FIB retracement at 1745$.
In case of a bearish breakdown below the double bottom on the weekly chart at 1614$, that will resume the bearish wave on the weekly chart and send the price of Gold lower. The first target in such a bearish development is the 0.618 FIB retracement on the monthly chart at 1505$. The second target is the 1.272 FIB extension on the monthly chart at 1375$.
Daily chart:

Weekly chart:

Monthly chart:


