|
Getting your Trinity Audio player ready...
|
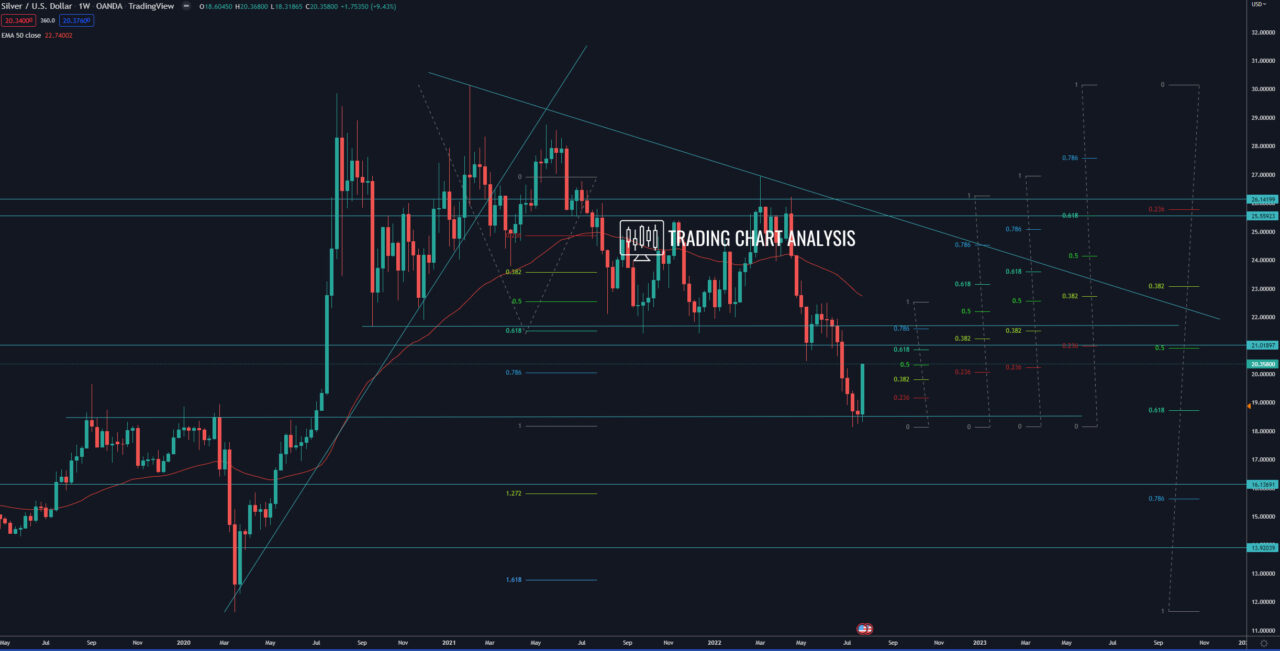
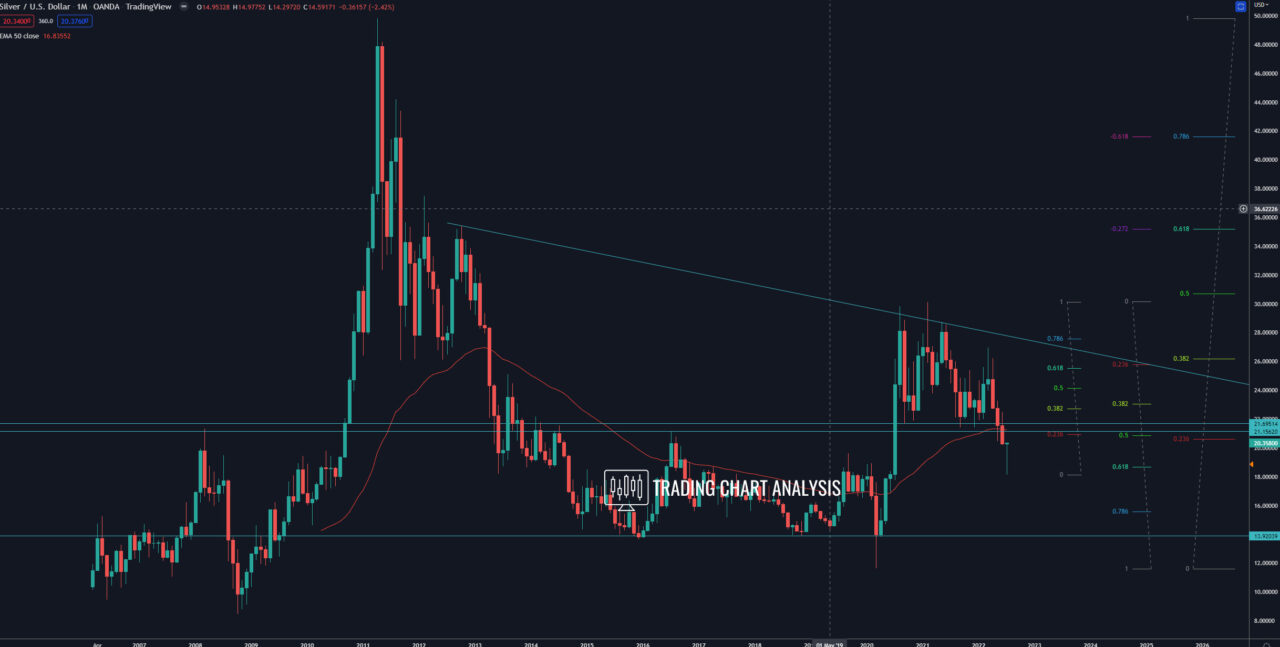
Technical analysis for Silver(XAG/USD), the price bounced from 0.618 FIB retracement on the monthly chart, and closed the month with a low-test candle pattern, starting a pullback. The first target for this pullback, the 0.382 FIB retracement on the daily chart at 19.82, was reached. The second target is the 0.618 FIB retracement on the daily chart at 20.85. The third target for the pullback in Silver is the 0.382 FIB retracement on the weekly chart around 21.25-50, which is a strong resistance zone. The fourth target is the weekly 50 EMA and resistance around 22.50.
Looking at the bigger picture, in June 2022 the price of Silver broke below the double bottom pattern on the monthly and the weekly chart. This breakout started a bearish wave on the weekly chart. The first target for this bearish wave, the 0.618 FIB retracement at 18.70, was reached. The second target for the bearish wave for Silver is the 0.786 FIB retracement at 15.55, which is a 1.272 FIB extension on the weekly chart.
Weekly chart:

Monthly chart:


