|
Getting your Trinity Audio player ready...
|
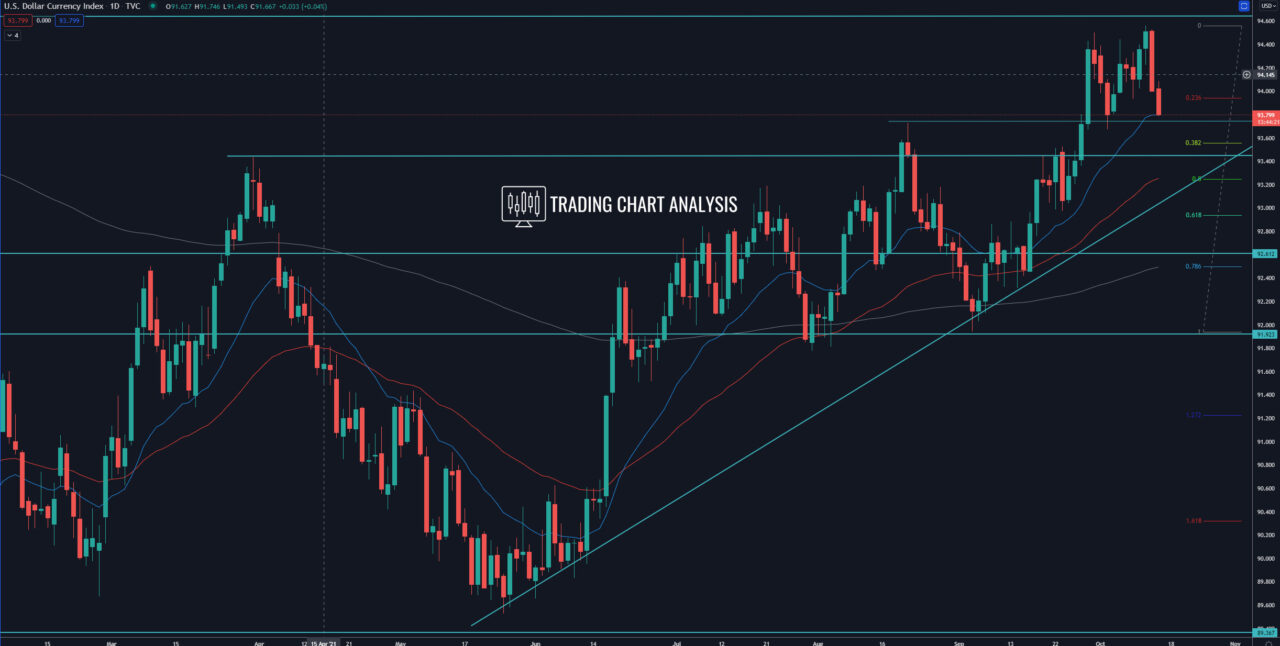
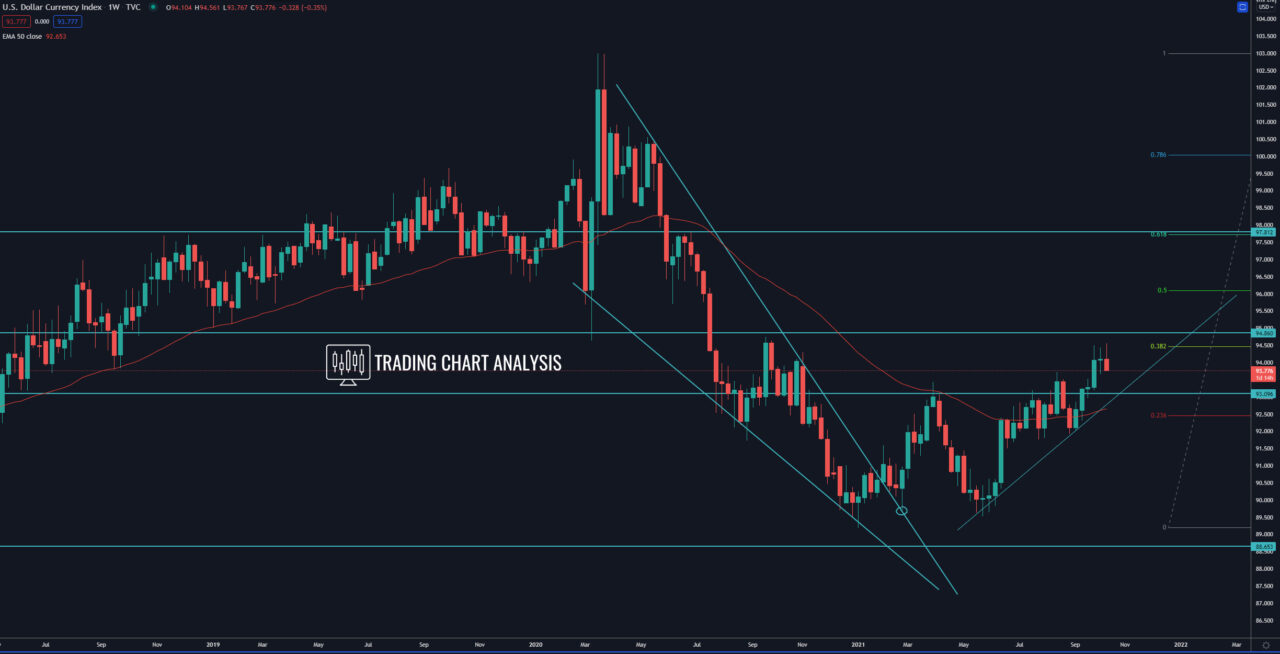
Technical analysis for the DXY dollar index, the price reached a key resistance and the 0.386 FIB retracement on the weekly and the monthly charts and started a pullback on the daily chart. The focus is now on the previous daily low at 93.68 and the 0.386 FIB retracement on the daily chart at 93.55. If the DXY dollar index breaks below the 0.386 FIB retracement at 93.55, it will open the door for a bearish run toward the 0.618 FIB retracement and the low at 92.98.
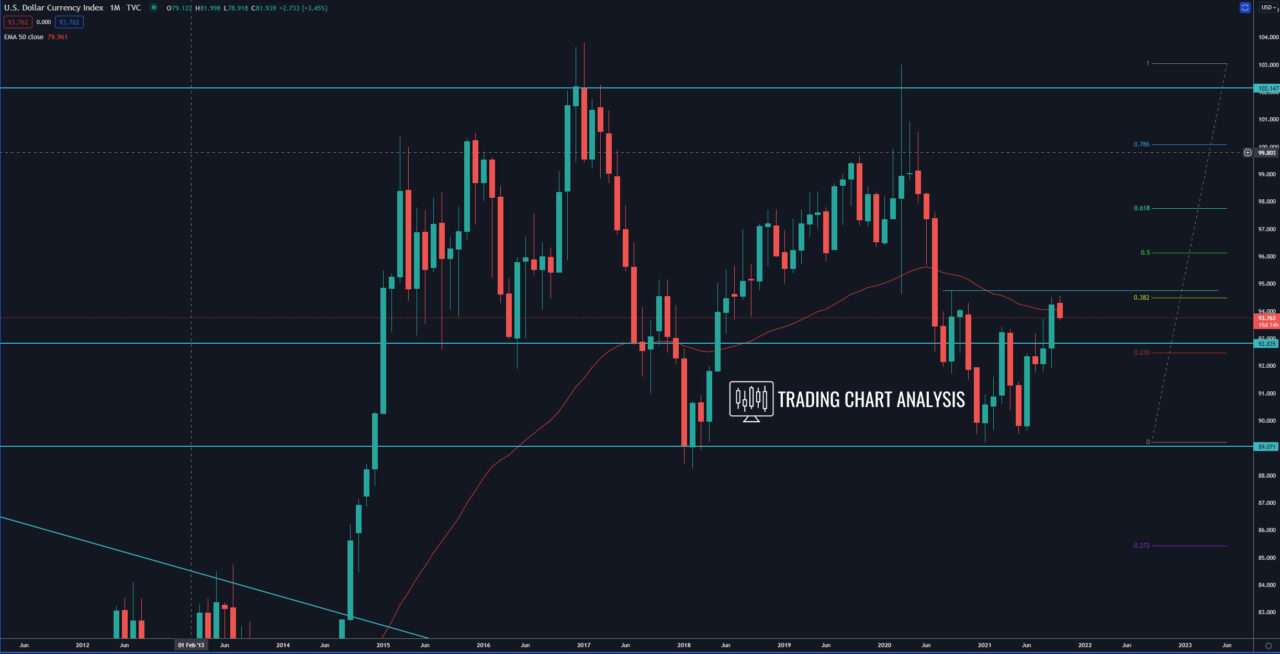
The previous monthly high at 94.74 is a key level for the DXY dollar index. If the index breaks above 94.74, that will have bullish implications, and it will send the DXY index higher toward the 0.618 FIB retracement on the monthly chart at 97.75.
Daily chart:

Weekly chart:

Monthly chart:


