|
Getting your Trinity Audio player ready...
|
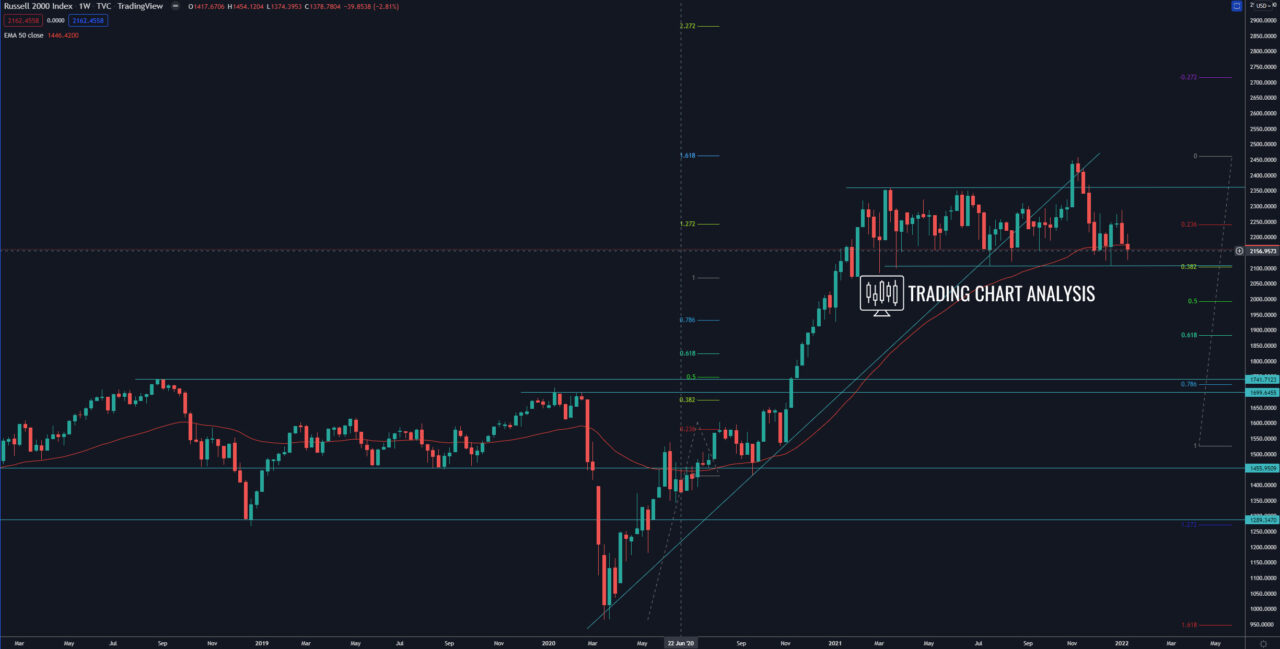
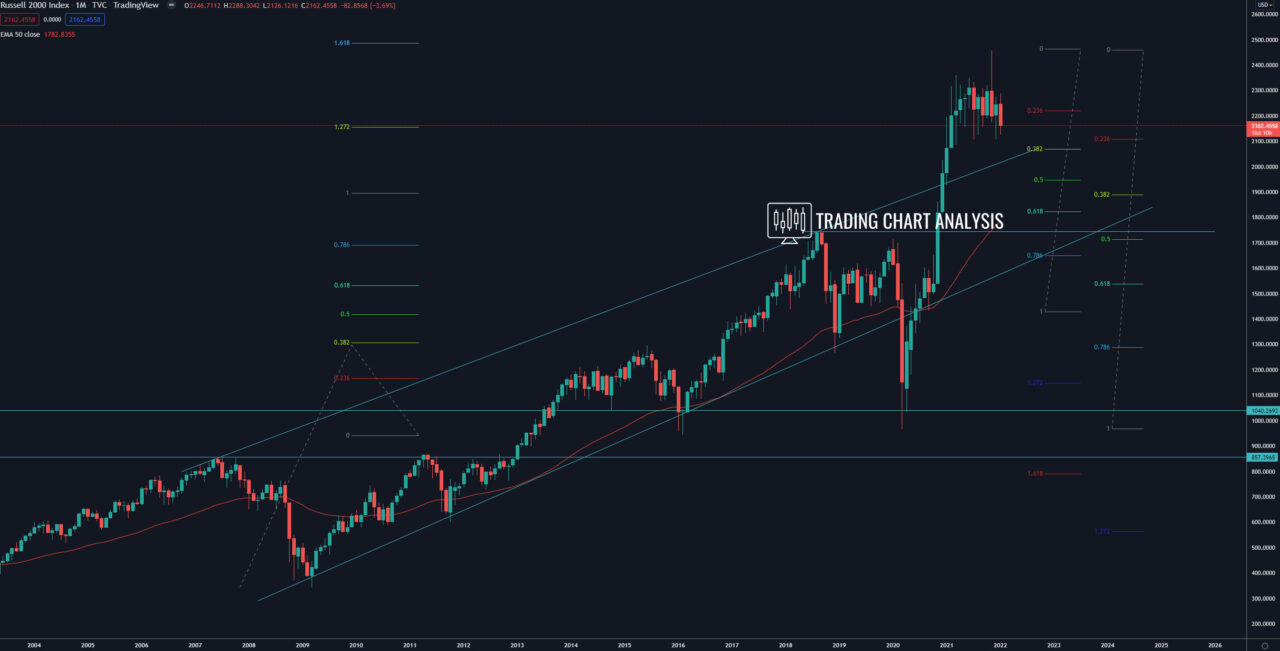
Technical analysis for Russell 2000, the index reached the second target of the third bullish wave on the weekly chart (the 1.618 FIB extension at 2450) and started a pullback. The pullback reached the 0.382 FIB retracement on the weekly chart at 2100 and now the index Russell 2000 is consolidating. If the index breaks below the 0.382 FIB retracement on the weekly chart, that will open the door for declines toward the 0.618 FIB retracement at 1885. That is also the 0.382 FIB retracement on the monthly chart.
On the bullish side, if the Russell 2000 break above the previous all-time high at 2458, that will resume the bullish trend. The third target of the bullish wave on the weekly chart is the 2.272 FIB extension at 2880.
Weekly chart:

Monthly chart:


