|
Getting your Trinity Audio player ready...
|
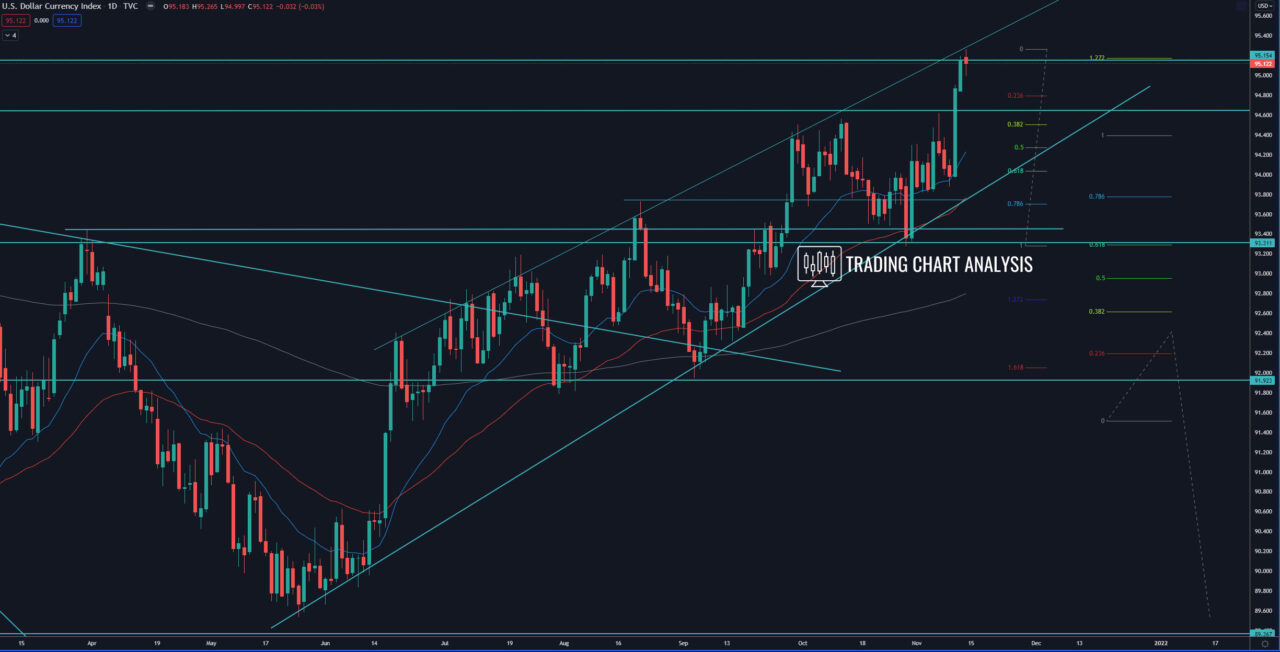
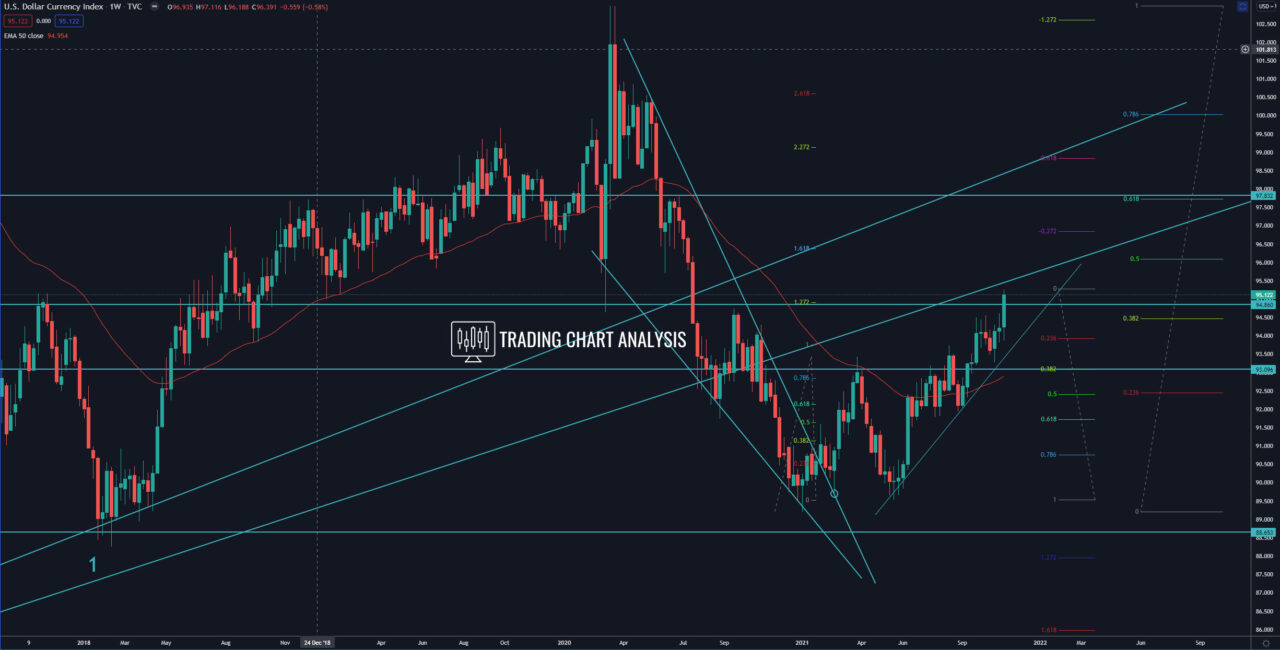
Technical analysis for the DXY, the dollar index broke out to the upside, a signal for further upside potential. The DXY dollar index closed above the 0.386 FIB retracement and the September 2020 high at 94.74. This breakout opened the door for a bullish run toward the 0.618 FIB retracement on the monthly chart at 96.70. However, at the moment, the index is facing both dynamic and horizontal resistance, and that might be enough to start a pullback. Therefore, the short-term focus is on the daily chart and the top of the ascending price channel, and the horizontal resistance around 95.15.
The key support for the DXY dollar index is the support between 94.40 – 93.30, where we have the 0.386 FIB retracement on the weekly chart at 93.10. Therefore, the zone between 93.10-93.30 should be monitored for buying opportunities.
Daily chart:

Weekly chart:


