|
Getting your Trinity Audio player ready...
|
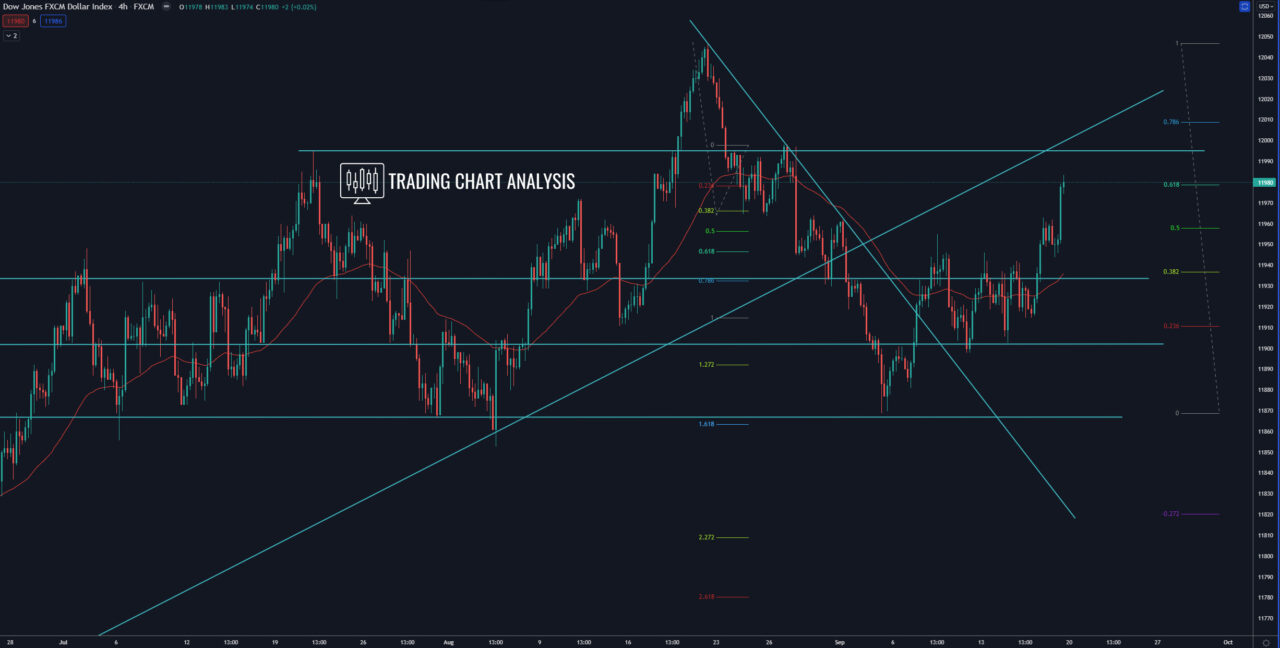
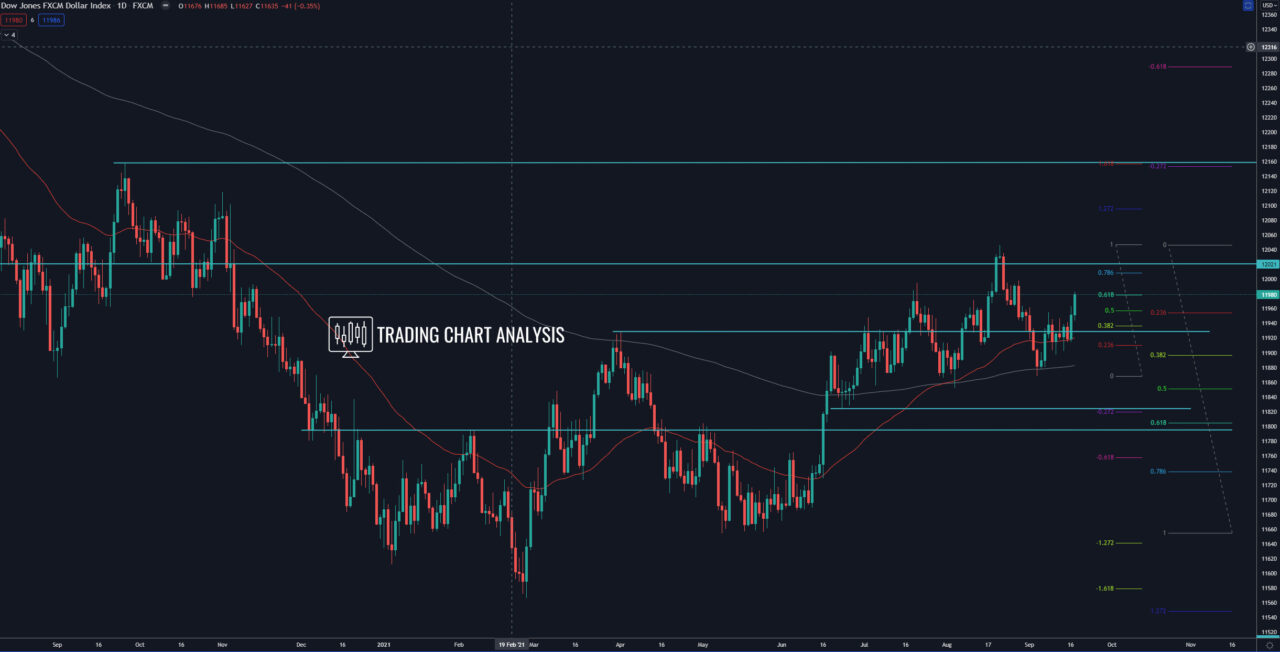
The FXCM dollar index breakout of six days range to the upside on four hour and the daily charts and closed the weekly chart with a bullish candle, bouncing from a support, which was previously broken and now retested. This is a signal for further upside potential toward, first the previous high and resistance at 11 995, and second toward the 1.272 FIB extension (on the four hour chart) at 12 010. The third target of this bullish move is the 1.618 FIB extension at 12 037 and the previous high at 12 047.
However, the price is sitting at 0.618 FIB retracement and there is a potential Head and Shoulder pattern on both the daily and the four hour charts. Therefore we must watch the resistance zone between 11 980 – 11 995 for rejection and formation of the right shoulder of this Head and Shoulder and watch if this pattern will develop.
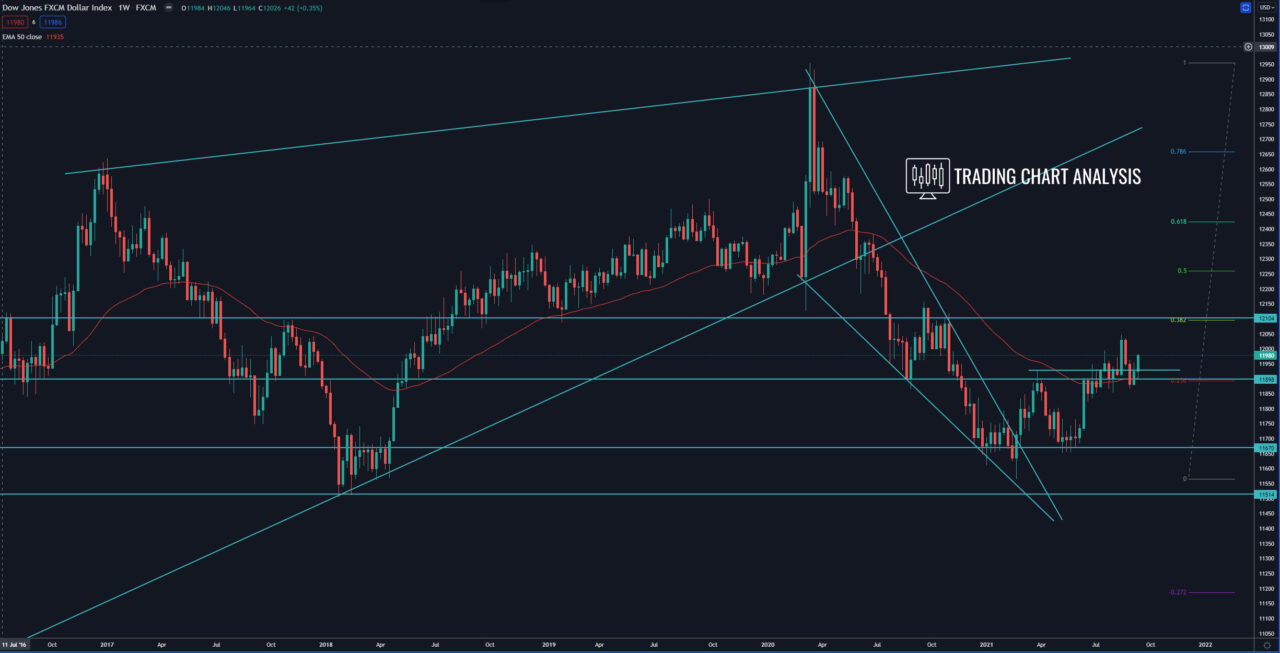
On the weekly chart, since the FXMC dollar index broke out of ascending wedge, the price is in a bullish run. The first target of this bullish run is the 0.386 FIB retracement at 12 096 and the high at 12 158. As long as the price is trading above 11 660 the weekly bullish run will be valid.
4H chart:

Daily chart:

Weekly chart:


