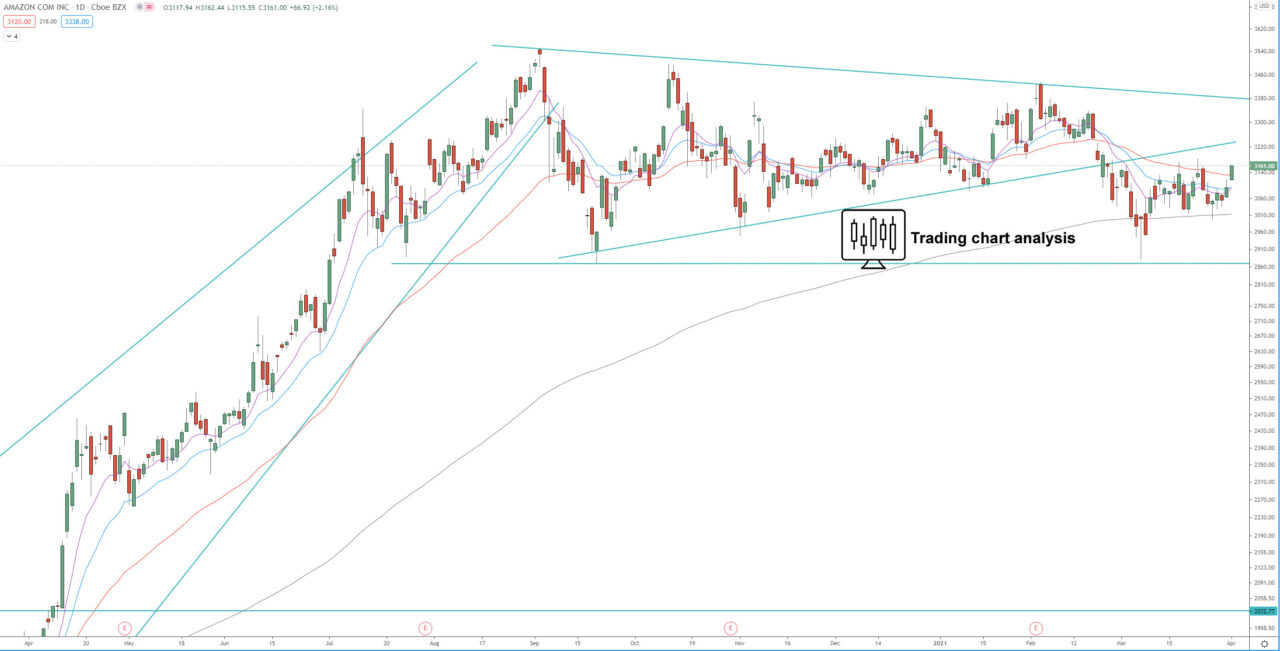
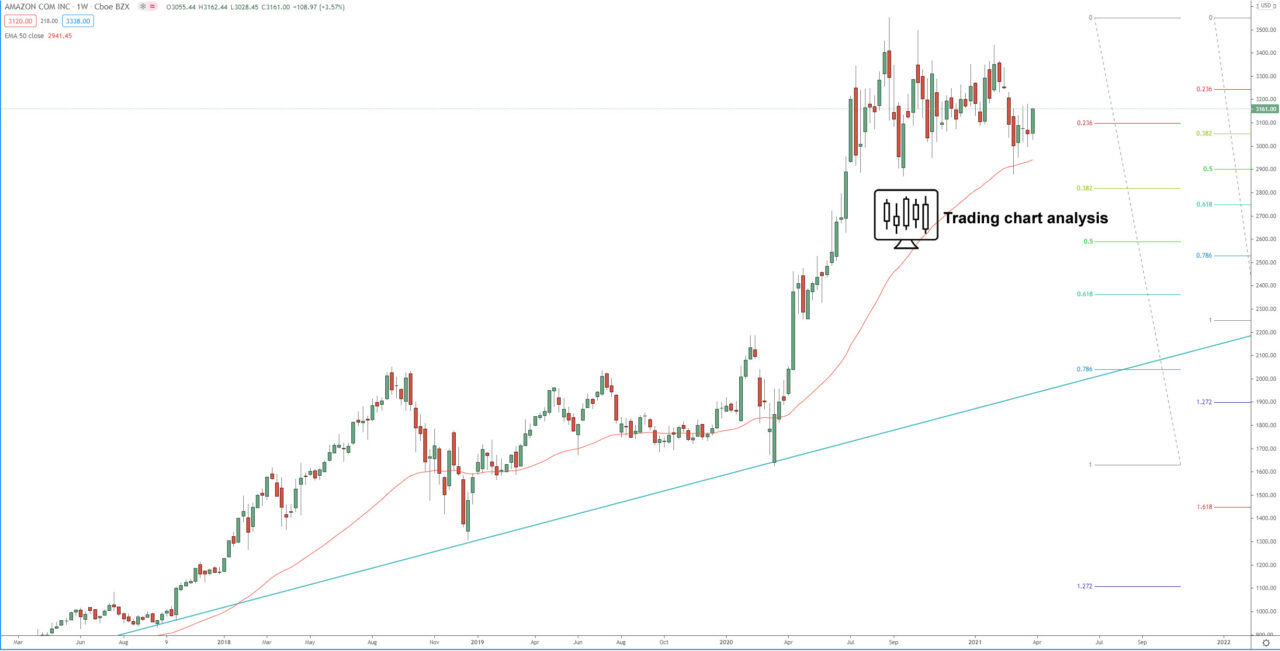
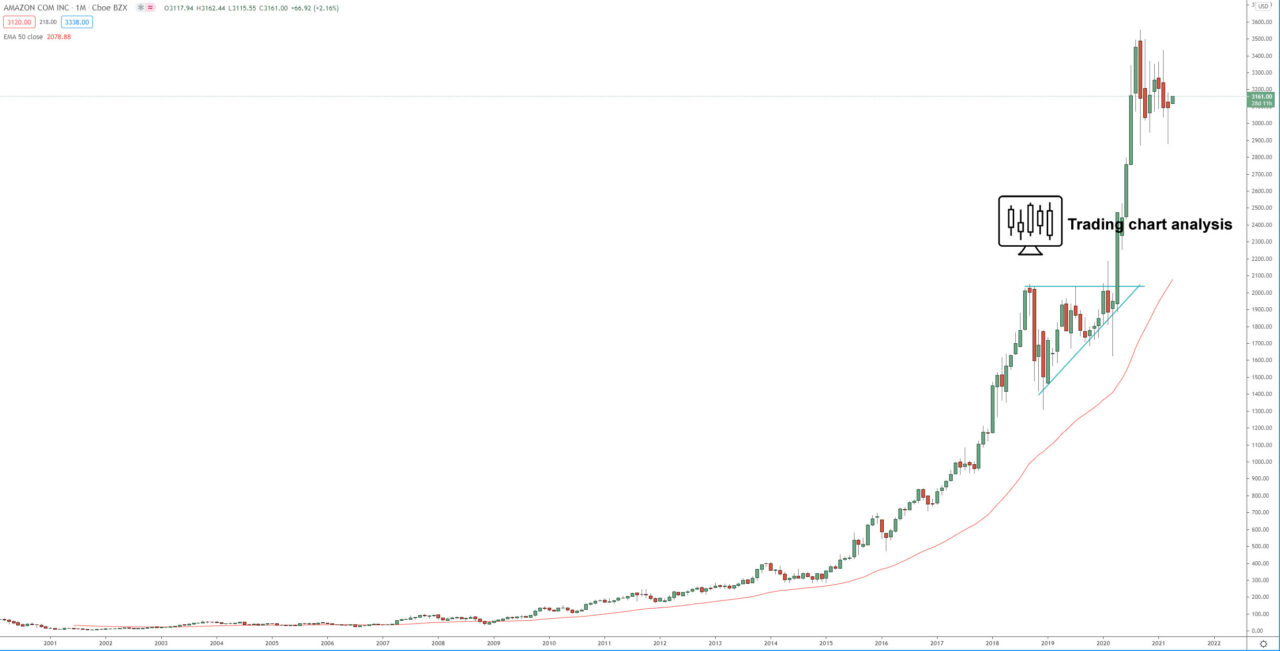
Technical analysis for Amazon Com Inc. (AMZN) is showing that the shares reached the 2nd target of the 5th monthly bullish wave at 1.272 FIB extension at $3555 and started consolidation. This consolidation lasted 6 months and resulted in the top to a bottom decline of around -19.00%.
The price formed a low-test candle on the monthly chart rejecting the bottom of the consolidation, and double bottom on the weekly chart, signaling a potential bottoming and resumption of the bullish trend. If Amazon Com Inc. (AMZN) shares break above $3182, it will be an early signal for resumption of the bullish trend, and it will send the price toward, first $3330 and second toward the previous high at $3552. If the price breaks above 3552, it will extend the monthly and weekly bullish trend and send the shares toward, first at 2.272 FIB extension of the weekly bullish wave at 3840-50, and second towards the 1.618 FIB extension of the monthly bullish wave at 4160 – 4200.
On the other hand, if the Amazon Com Inc. (AMZN) shares break below the consolidation range, below $2871, it will send the price lower toward, first 1.272 FIB extension of the bearish daily run at 2660, and second toward 1.618 FIB extension around 2520.
Review our technical analysis for Amazon Com Inc. (AMZN) for 2021 targets.
Daily chart:

Weekly chart:

Monthly chart:


