|
Getting your Trinity Audio player ready...
|
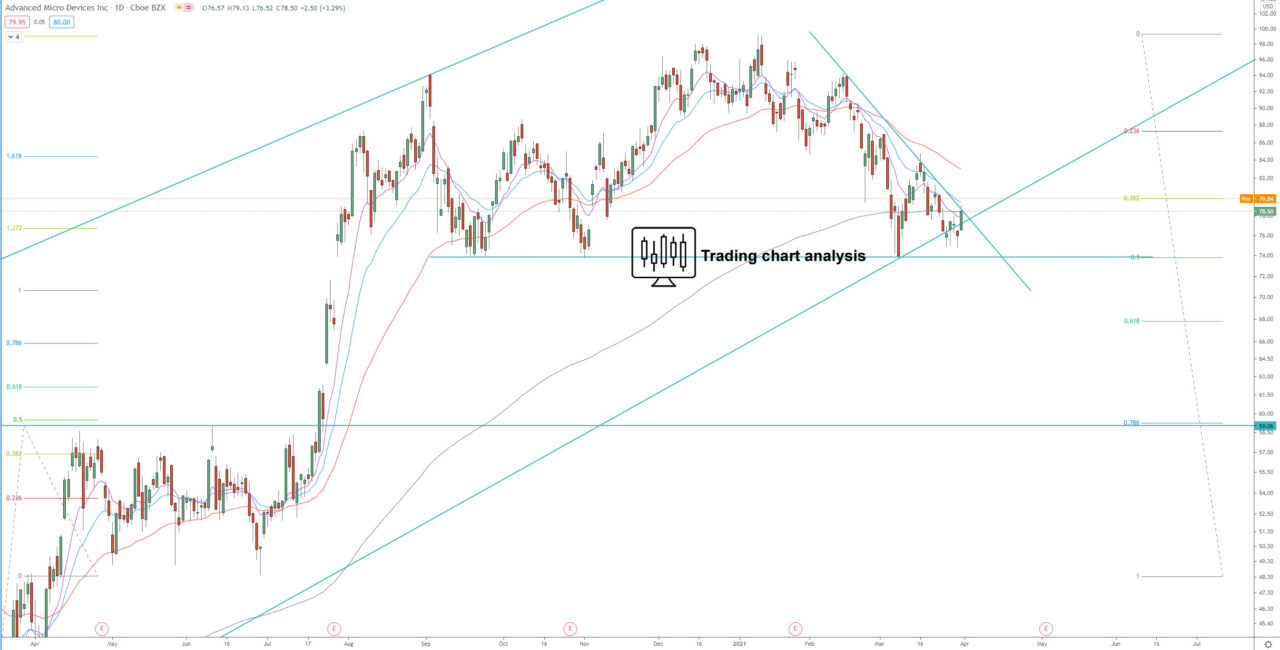
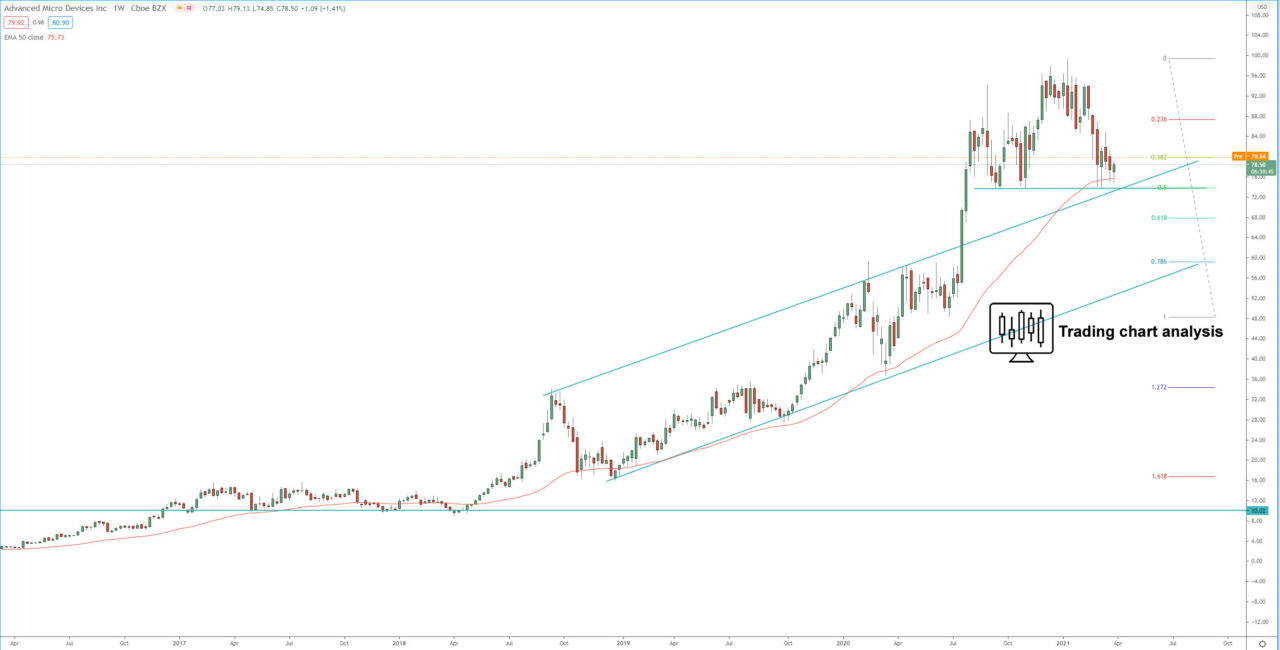
Technical analysis for (AMD) Advanced Micro Devices is showing that the shares reached the 3rd target of their 5th monthly bullish wave at 1.272 FIB extension at 92$. The shares went as high as 99.23, which was the 3rd target of the daily bullish run at 2.272 FIB extension at 99.00. The price failed to break above 98-99 twice, and that started a -25.00% decline in the AMD shares. The price reached both horizontal and dynamic support and 0.500 FIB retracement for the last bullish daily run and bounced from it. If the price break below the support between 73.73 – 74.00, it will extend the bearish daily run toward, first 67.80 – 67.25, and second the 1.272 FIB extension toward 61.80.
On the other hand, if the price break above 84.75, it will be a signal for resumption of the monthly weekly trend, and it will send the price toward the 94.00 – 99.00 resistance zone. If the (AMD) Advanced Micro Devices shares break above 98-100, it will resume the bullish monthly and weekly trend and send the price toward, first 107.00, and then toward the 1.618 FIB extension of the 5th weekly bullish wave around 118.00-120.00.
Daily chart:

Weekly chart:


