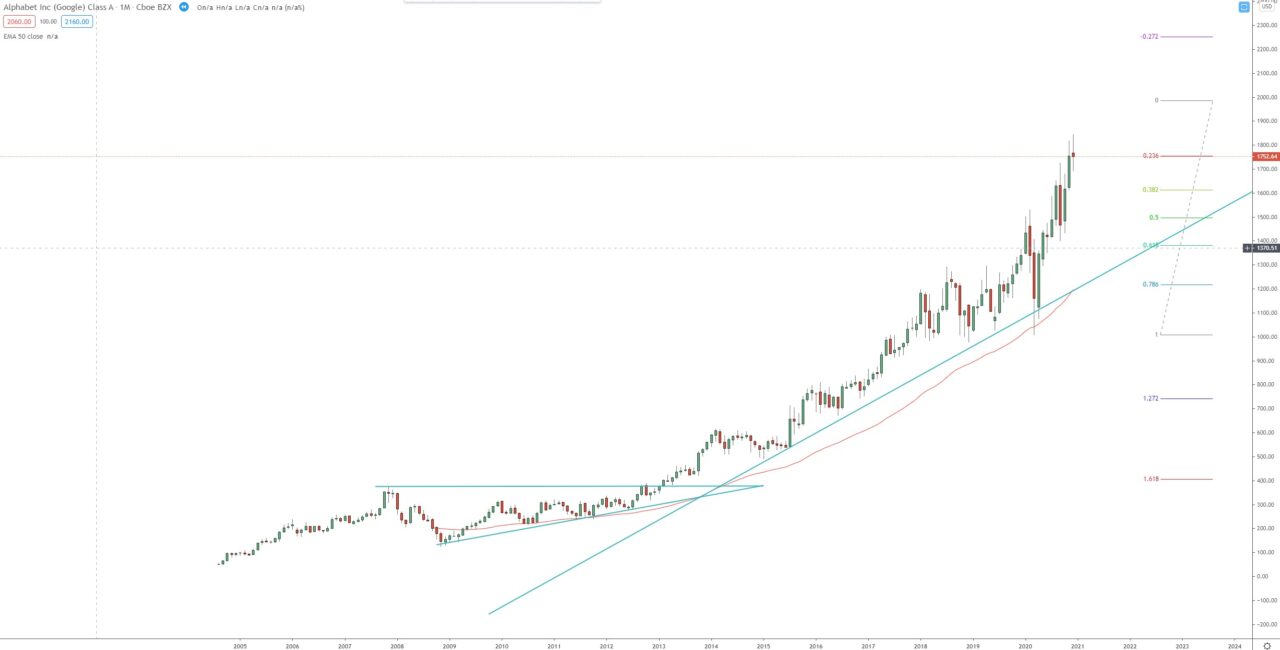
The price broke above the 2007 high, above 374.00$, in February 2013, that break, later on led to the start of the 3rd monthly bullish wave. The price reached and exceeded the first target of that bullish wave at 1.618 FIB extension around 1415.00$, it went as high as 1530.00$ before the decline of a -34.00%.
In the middle of 2020, we witnessed break above that 1530.00$ high and extension of that 3rd bullish monthly wave toward the 2.272 FIB extension around 1790 – 1800.00$ which the price reached at the end of 2020. Next target for that bullish monthly wave is at 2.618 FIB extension around the 2000.00$. If the price reached that 2000.00$ we may see consolidation and perhaps later on a pullback.
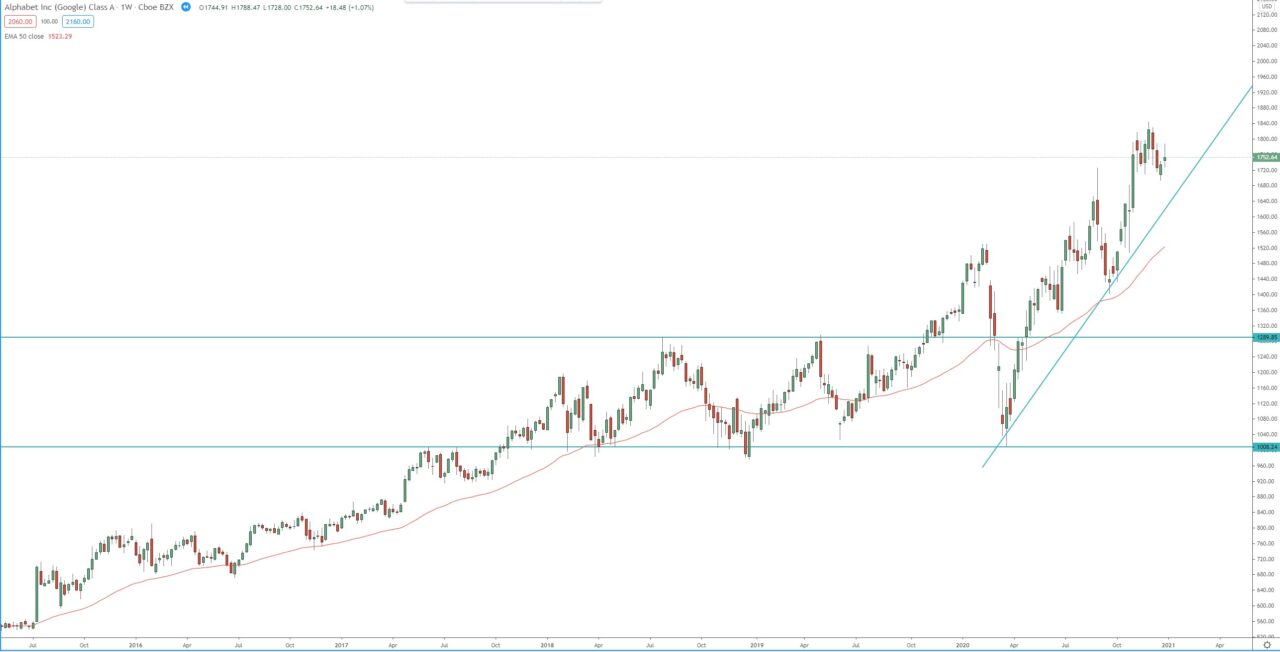
On the weekly chart we have minor support around 1695.00$, break below that will send the price lower toward 1400.00$ support. We also have a dynamic support, ascending trend line on the weekly chart, that must be monitored as well.
Monthly chart:

Weekly chart:


