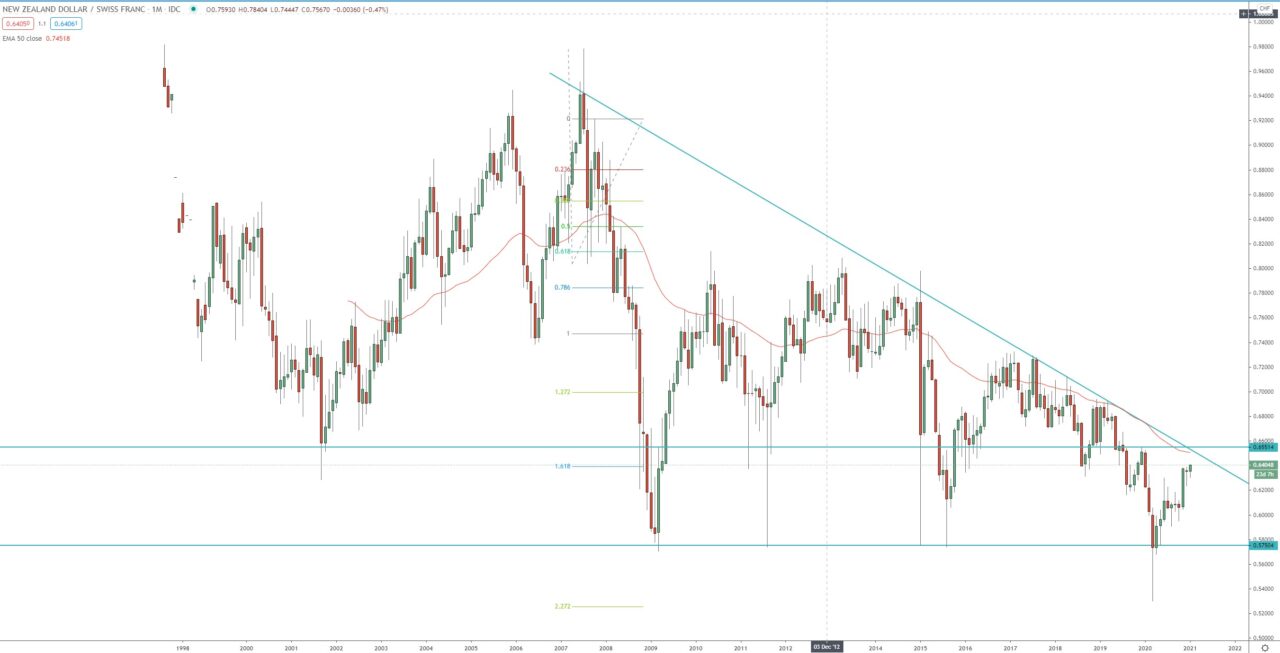
The price held that 2009 low on the monthly chart, despite the fact that briefly broke below it on the weekly and daily chart in the begging of the COV19 pandemic in 2020.
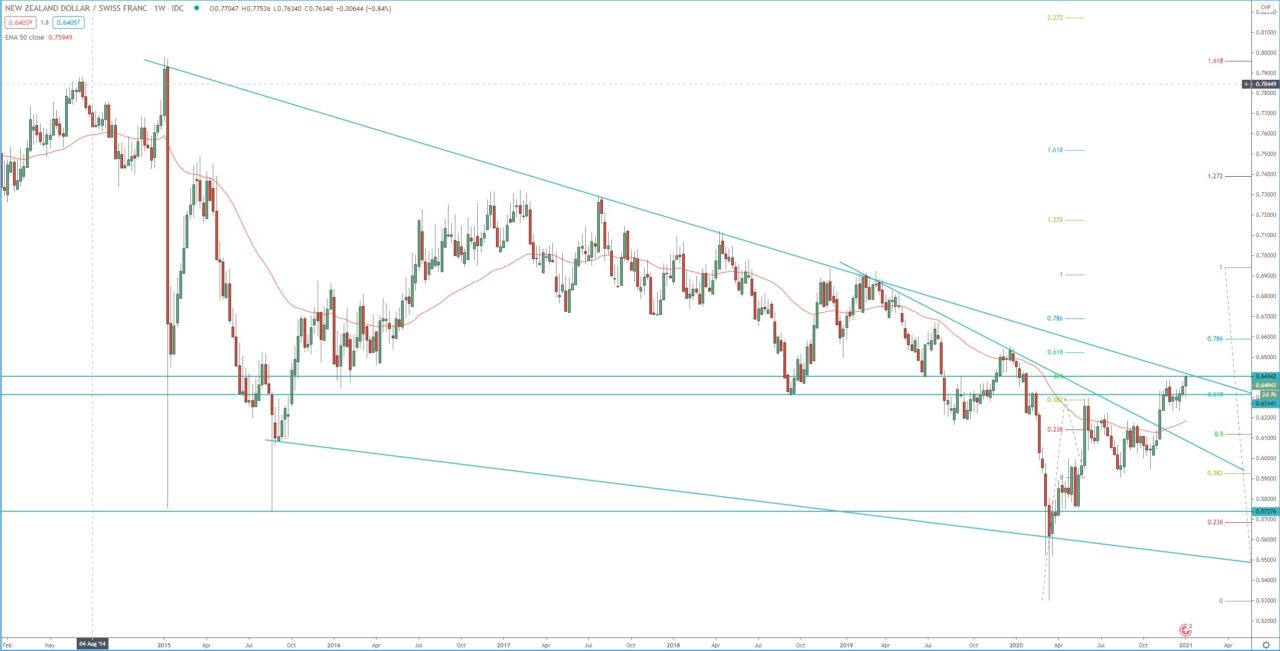
The price is now within the 3rd bullish weekly wave, the first target for this wave is the 1.272 FIB around 0.7170. However, before that we need to see break above strong resistance between 0.6320 – 0.6550, where we have both dynamic and horizontal resistance, break above that will confirm and extended the current bullish weekly trend.
Monthly chart:

Weekly chart:


