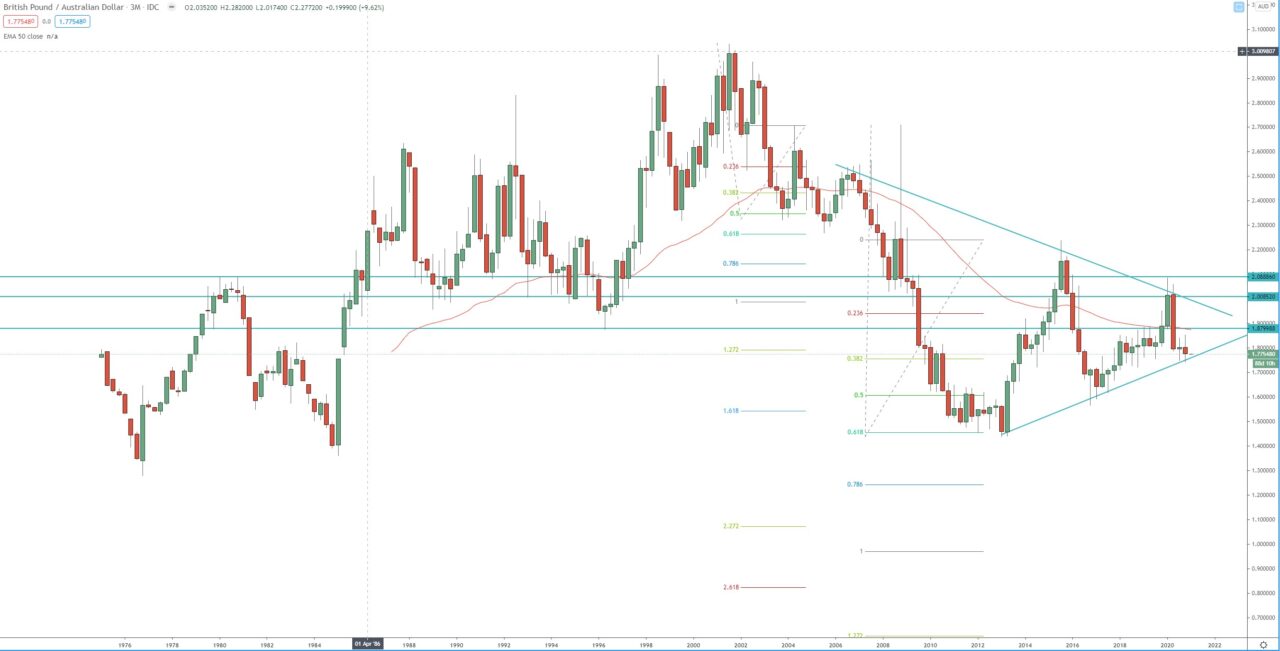
Looking at the quarterly chart we can determinate that the bearish trend hasn’t concluded yet we are in the 4th wave pullback and below key resistance zone, below 2.0880! Therefore, we expect to see at some point retest of the 1.4500 low! This view will be invalidated if the price break/close above 2.17 on the a quarterly chart!
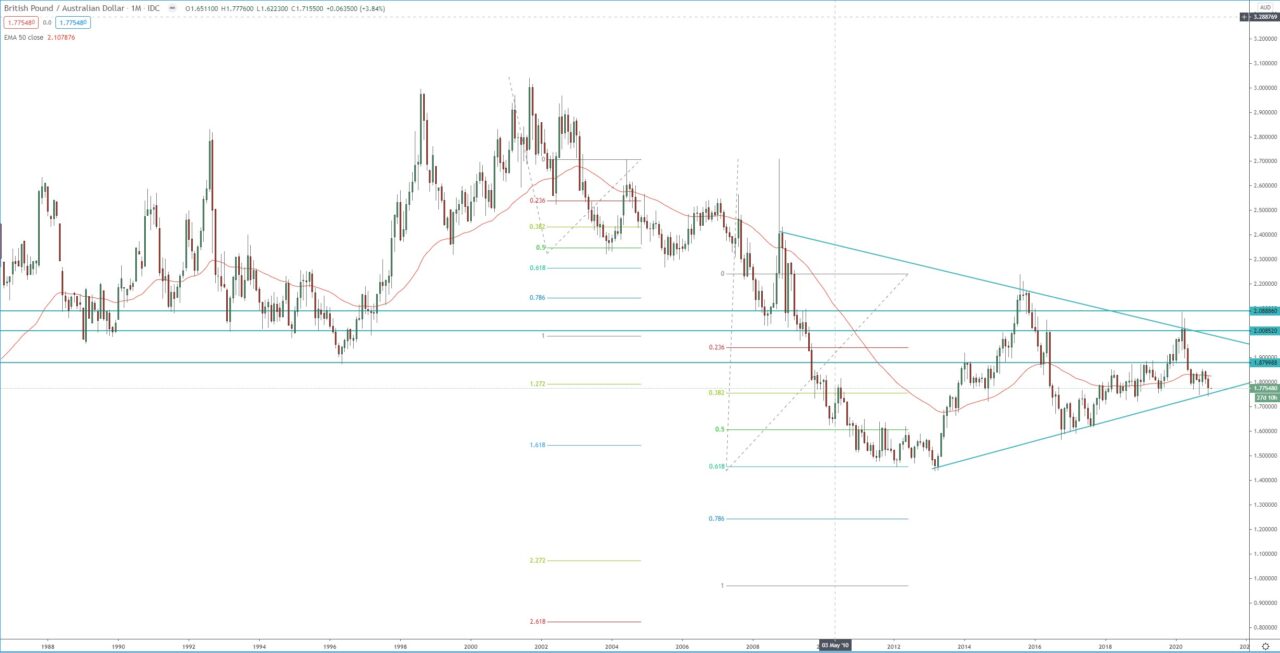
The monthly chart is painting the same picture, if the price break below this dynamic resistance there isn’t much structure to provide support until the 1.4500 low, we only have some support around 1.6200.
The weekly is sitting at dynamic and horizontal support around 1.7500, if the price breaks this key support, it will confirm the 3rd wave of this weekly bearish run and the first target for that run is at the 1.272 FIB around 1.4500!
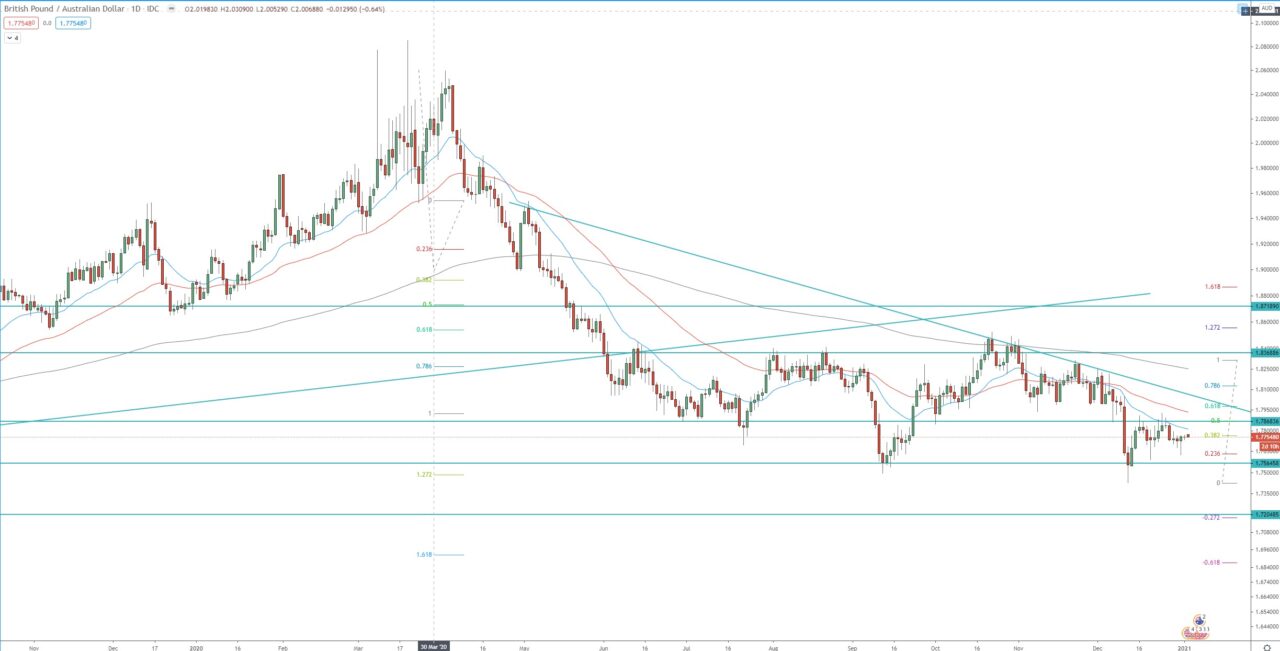
The daily is in its 3rd wave of the bearish run and reached its first target at 1.272 FIB around 1.7500 which is also strong horizontal support. The price star to bottoming at the key support and formed double bottom and consolidating within descending triangle, break below this key support with send the price first toward the next key support around 1.7200, second toward the 1.618 FIB extension around 1.6900. Key level to watch during 2021 is the resistance around 1.8300 – 1.8500 rejection of which should resume the bearish trend. The resistance at 1.9500 is key and need to be watched as well!
Quarterly chart:

Monthly chart:

Daily chart:


