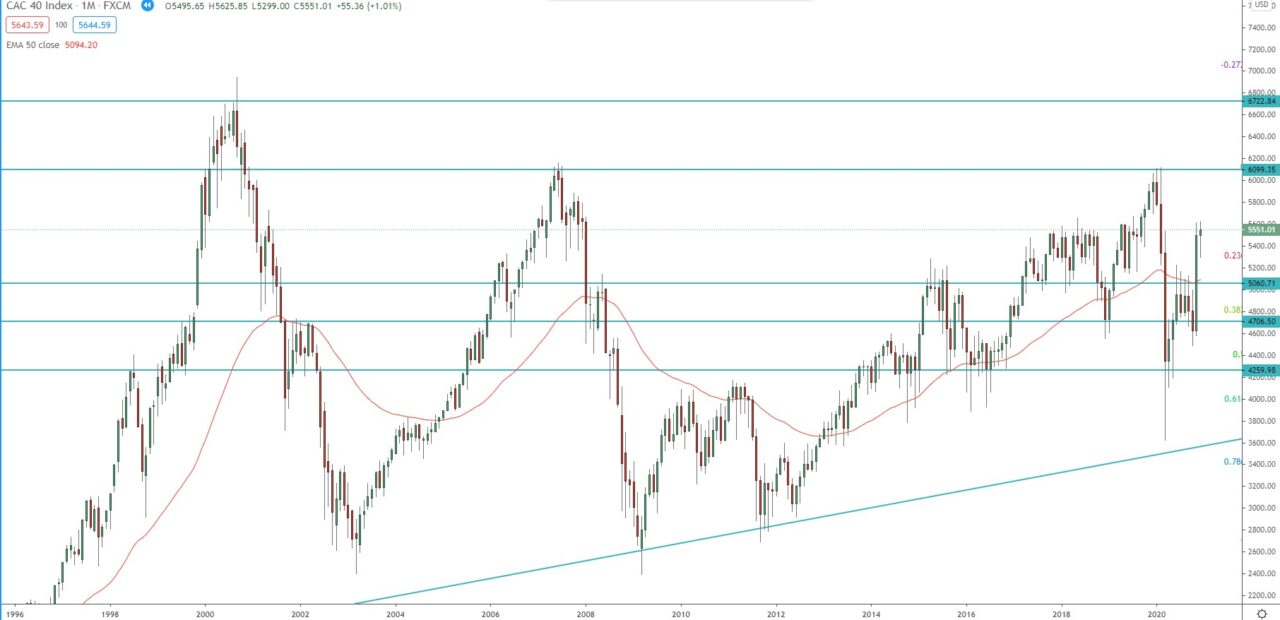
Long-term view, the monthly chart is in its 3rd bullish wave, ever since the index bottomed in 2011, the first target of this wave is the 1.272 FIB extension around 6200 and it was almost reached in January 2020. The second target of that wave is the 1.618 FIB extension around 6860 which is just below the all-time high for the index. However, before that we need to see break above strong resistance and 2020 high, above 6115.
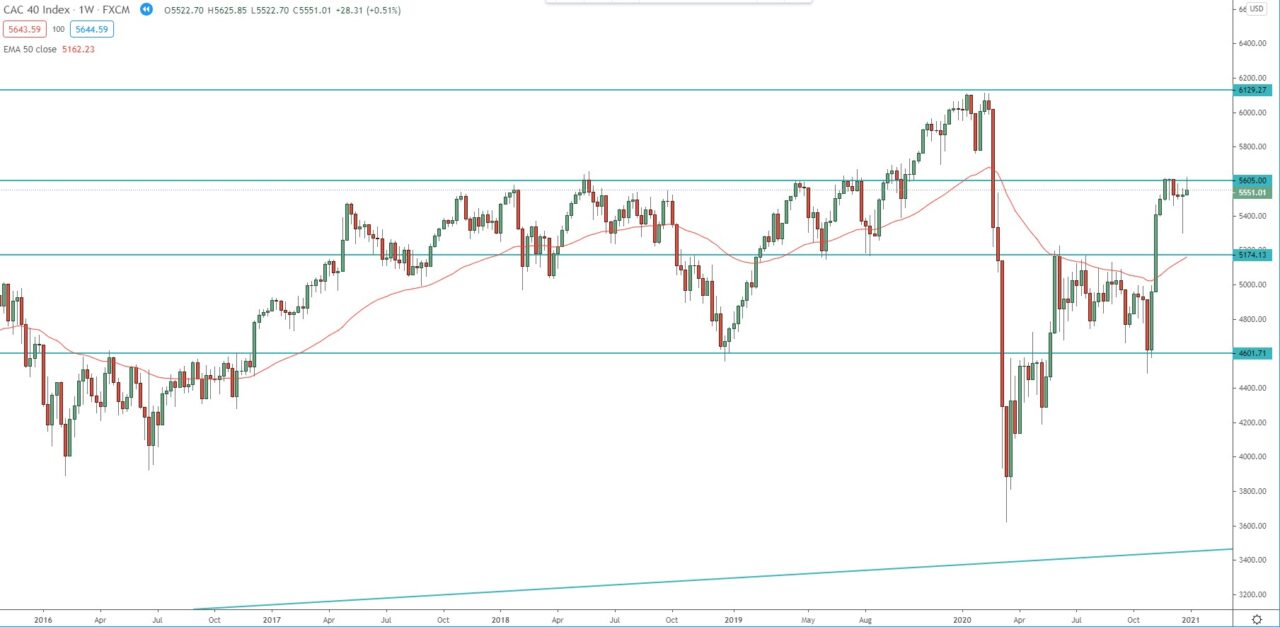
The weekly chart is also within 3rd bullish wave, the first target of this wave is the 1.272 FIB extension around 6500.
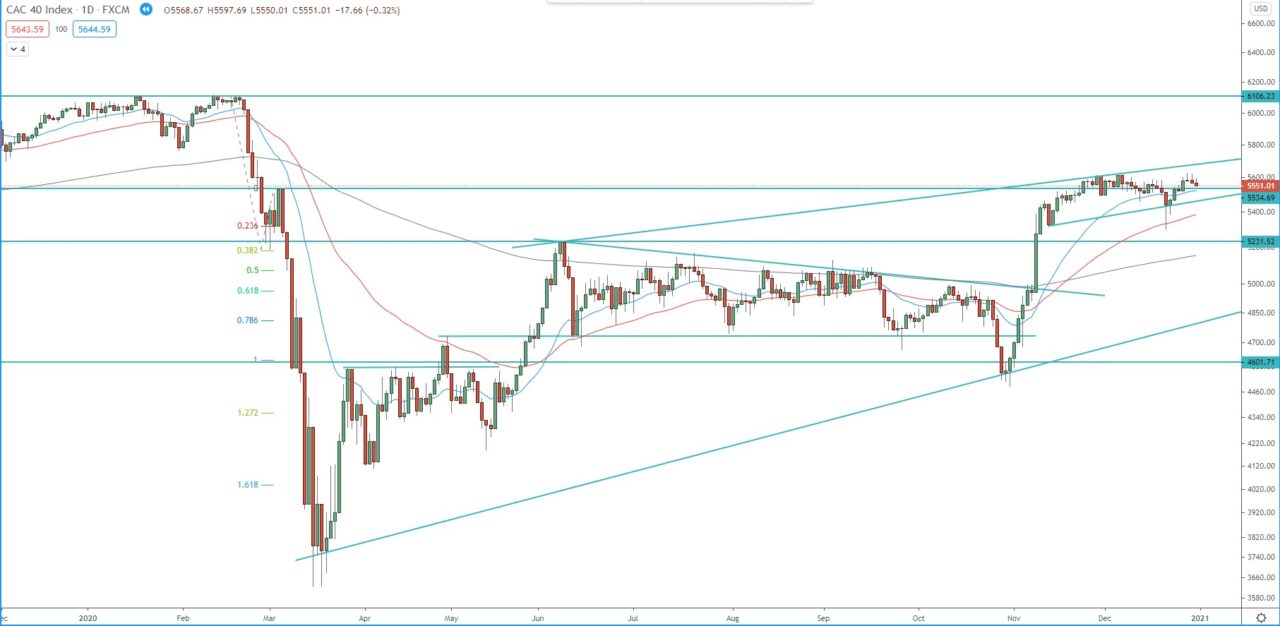
The daily chart has almost reached the second target of its 3rd bullish wave at 1.618 FIB extension around 5650 and now we may see some consolidation, before the next move higher toward the 2020 high at 6115. Strong support level to watch in case of a pullback is around 5200, watching this level for rejection and resumption to the daily bullish trend!
Monthly chart:

Weekly chart:

Daily chart:


