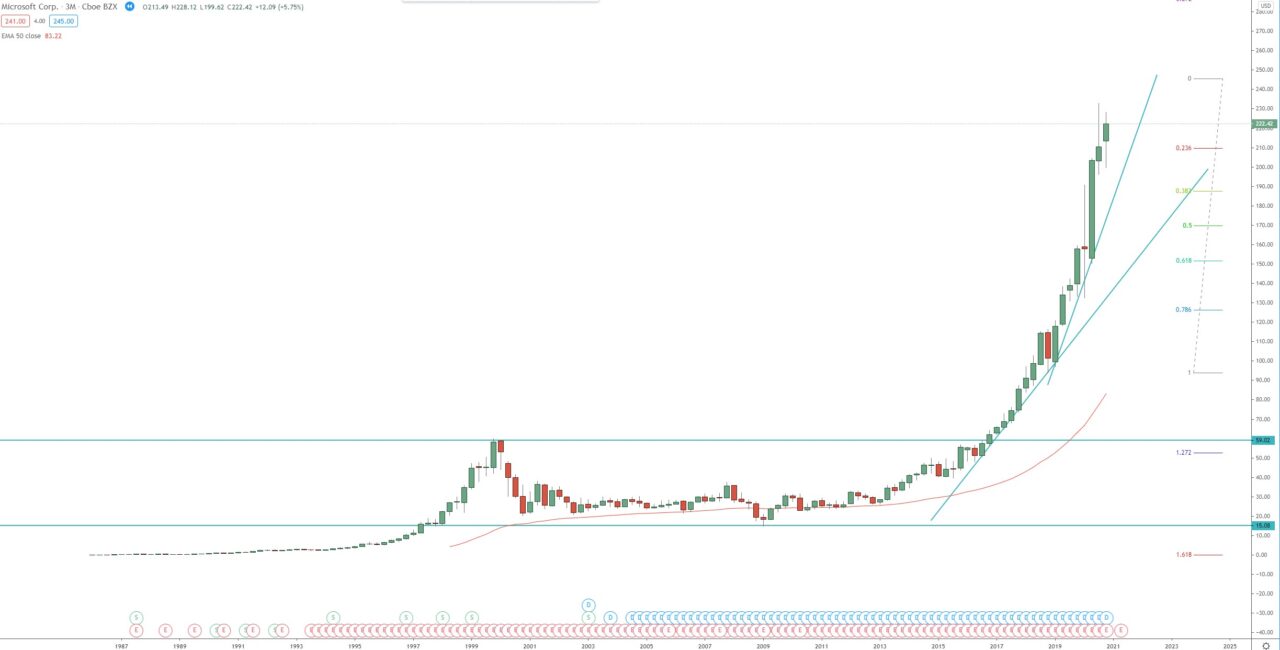
The price is within its 3rd bullish wave on the quarterly chart, which started with the breakout in 2016, break above the high around 60.00, December 1999 high. The first target of that wave is at 1.272 FIB extension around 222.00, and it was reached and exceeded. The price went as high as 232.86, before the 15.00% correction/decline.
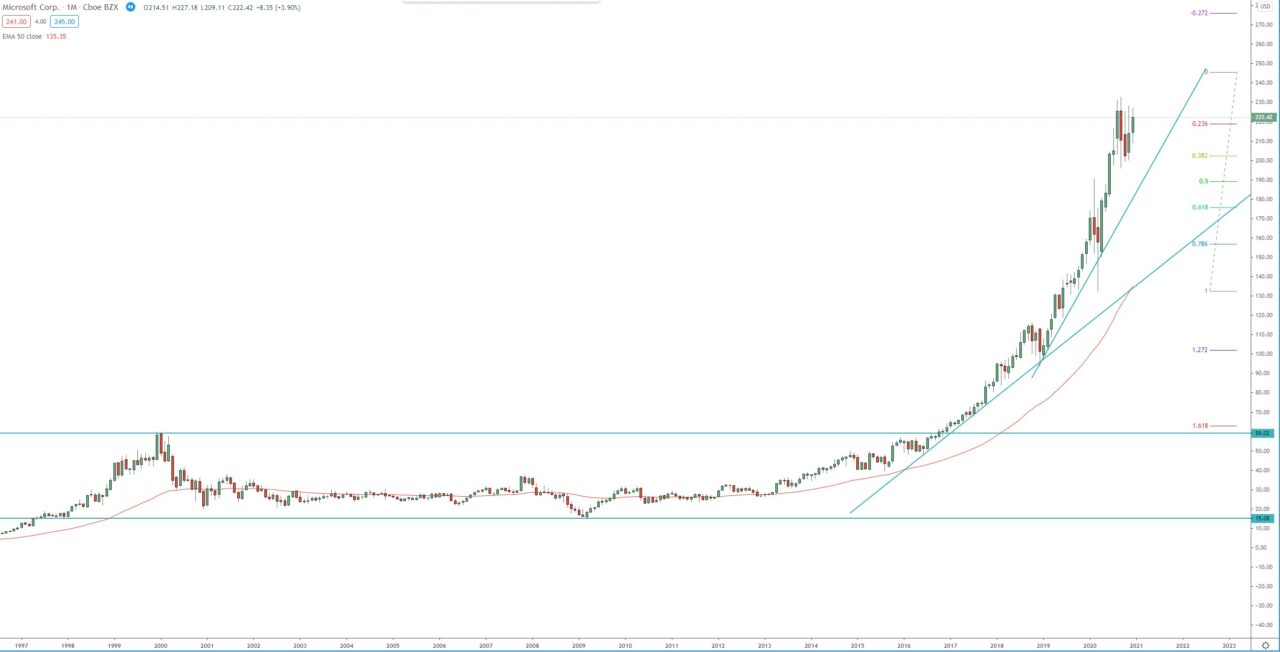
Currently the stock is in consolidation, between 196.00 – 232.86. If we see break above 232.86, next target of the 3rd quarterly bullish wave is at 1.618 FIB extension around 255.00.
Key support is the bottom of the range, around 196.00, break below it will suggest ABC pullback on the weekly chart and should send the price toward 0.618 FIB retracement around 170.
Quarterly chart:

Monthly chart:


