|
Getting your Trinity Audio player ready...
|
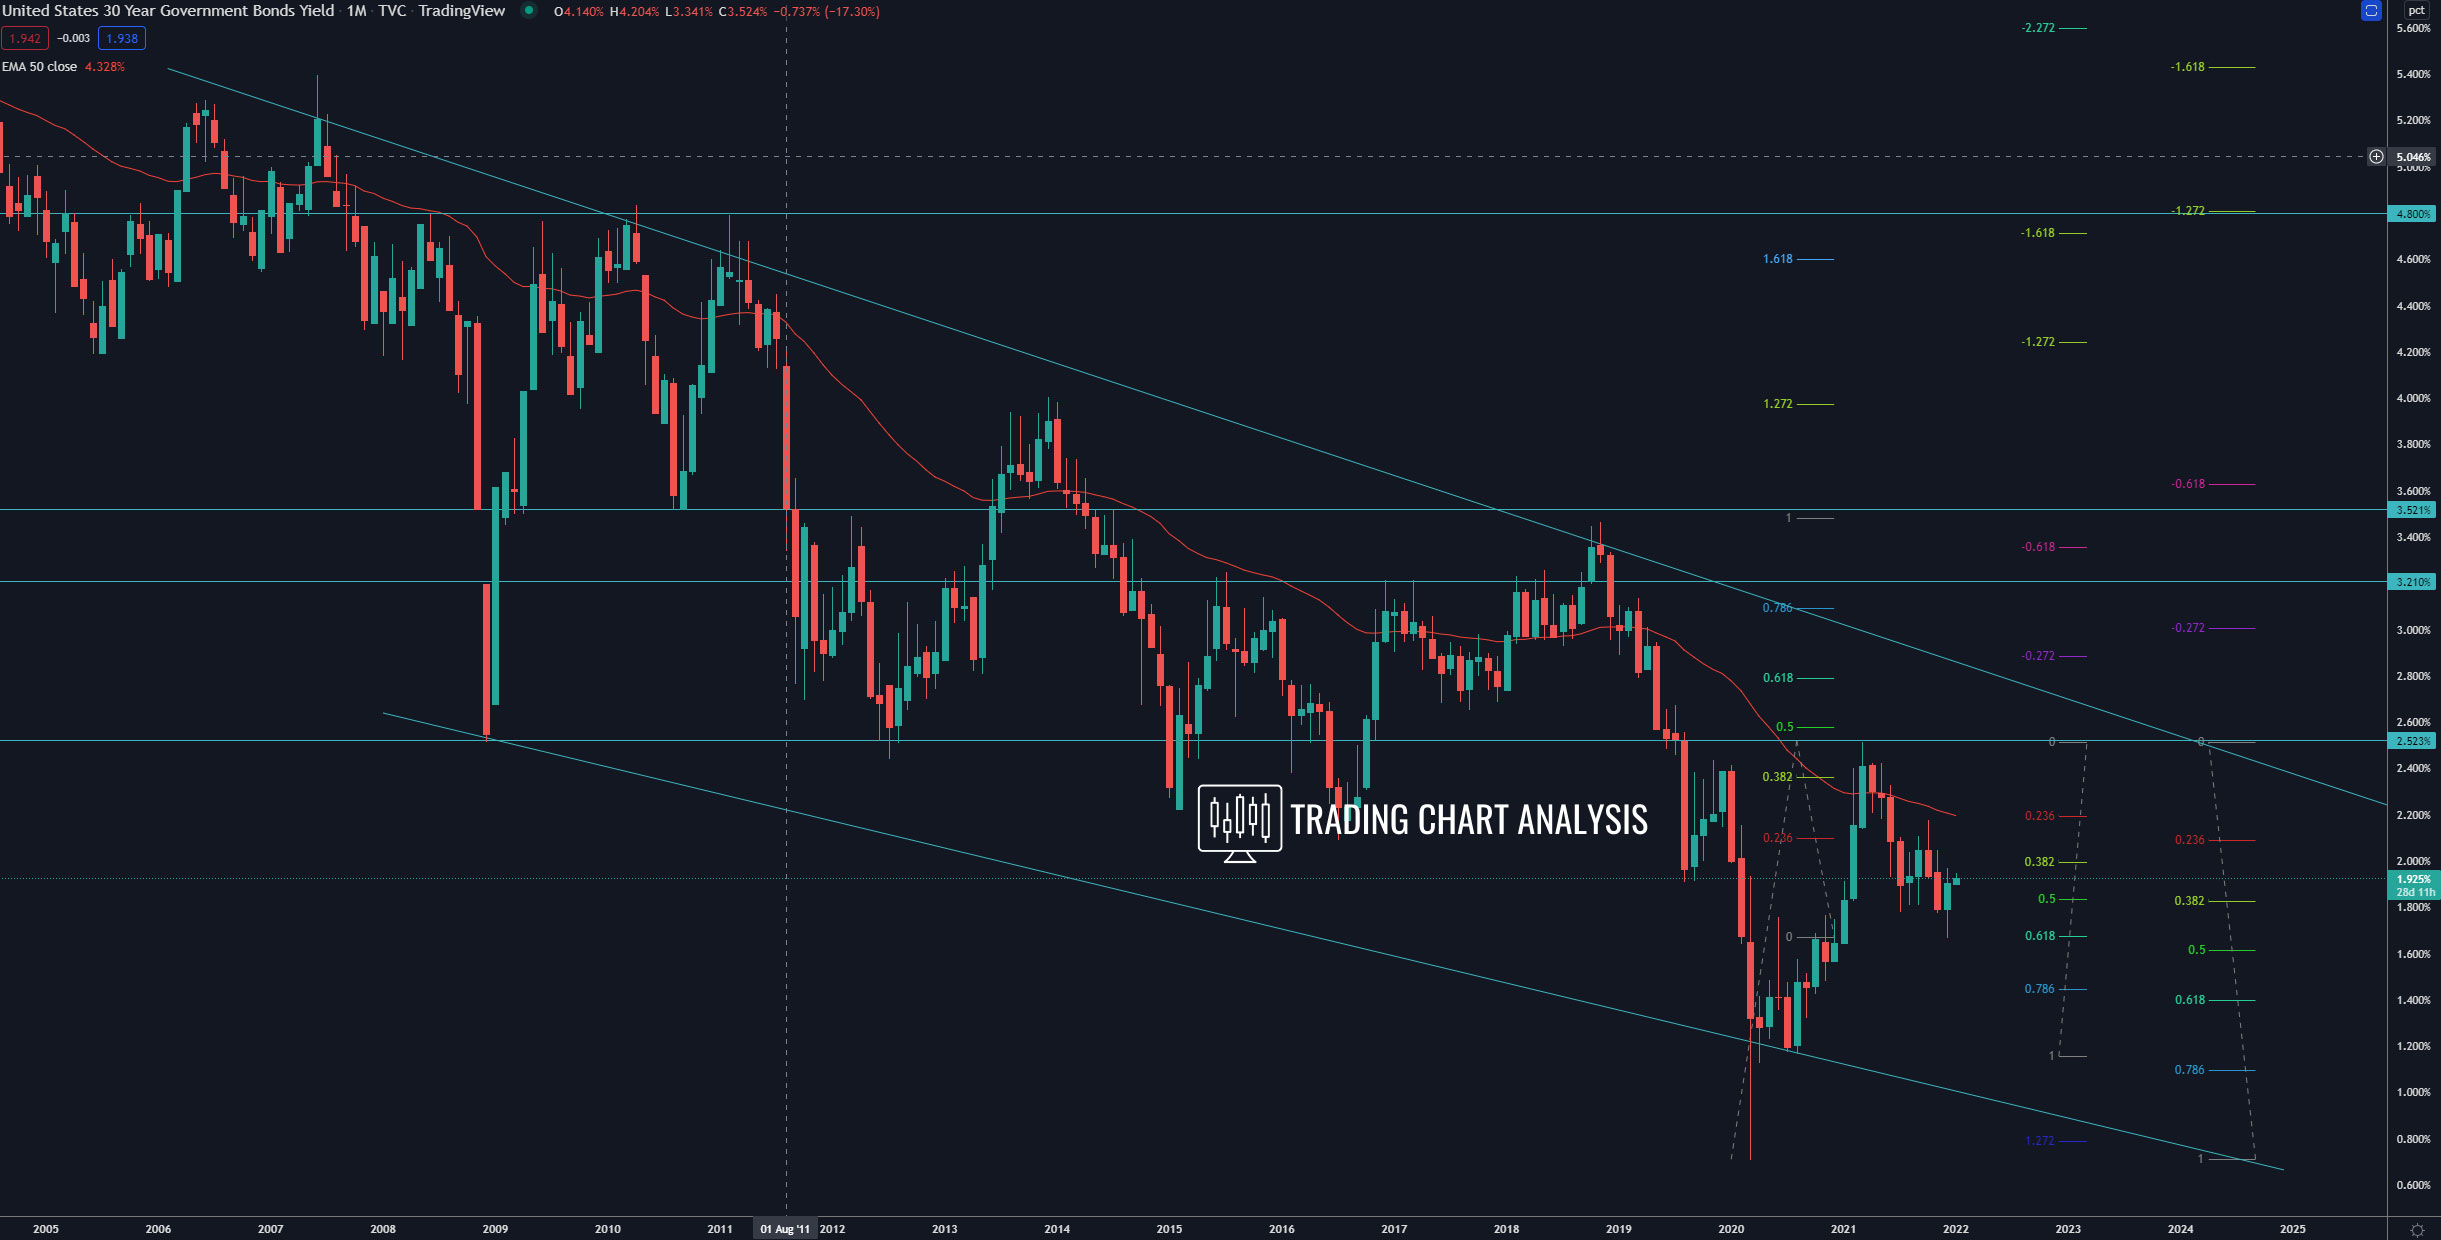
Technical analysis for the US Government bond 30-year yield, on the weekly chart, the price bounced from the 0.618 FIB retracement, and on the monthly chart, the 30-year US bond yield closed with a low-test candle, an early signal for the resumption of the bullish trend. If the 30-year yield break above the weekly high at 2.177%, that will confirm the resumption of the bullish trend. The first target of the bullish trend is the previous high on the monthly chart at 2.516%. Break above 2.516% will send the US 30-year yield higher. The second target for this potential bullish breakout is the 100 FIB extension on the monthly chart at 3.50%. The third target is the 1.272 FIB extension on the monthly chart at 3.97%-4.00%.
On the other hand, if the US 30-year yield breaks below the low on the weekly chart at 1.669%. That will open the door for a decline toward the 0.618 FIB retracement on the monthly chart at 1.40%.
Weekly chart:

Monthly chart: