|
Getting your Trinity Audio player ready...
|
Technical analysis for the US Government bond 10-year yield, on the weekly chart, the price broke out above the double top, which was formed in October and November of 2021. The bullish breakout is a signal for the resumption of the third bullish wave on the weekly chart. The first target of this bullish wave is the 1.272 FIB extension at 1.85%. The second target is the 1.618 FIB extension at 2.10%, which is just below the 0.618 FIB retracement at 2.15% on the monthly chart.
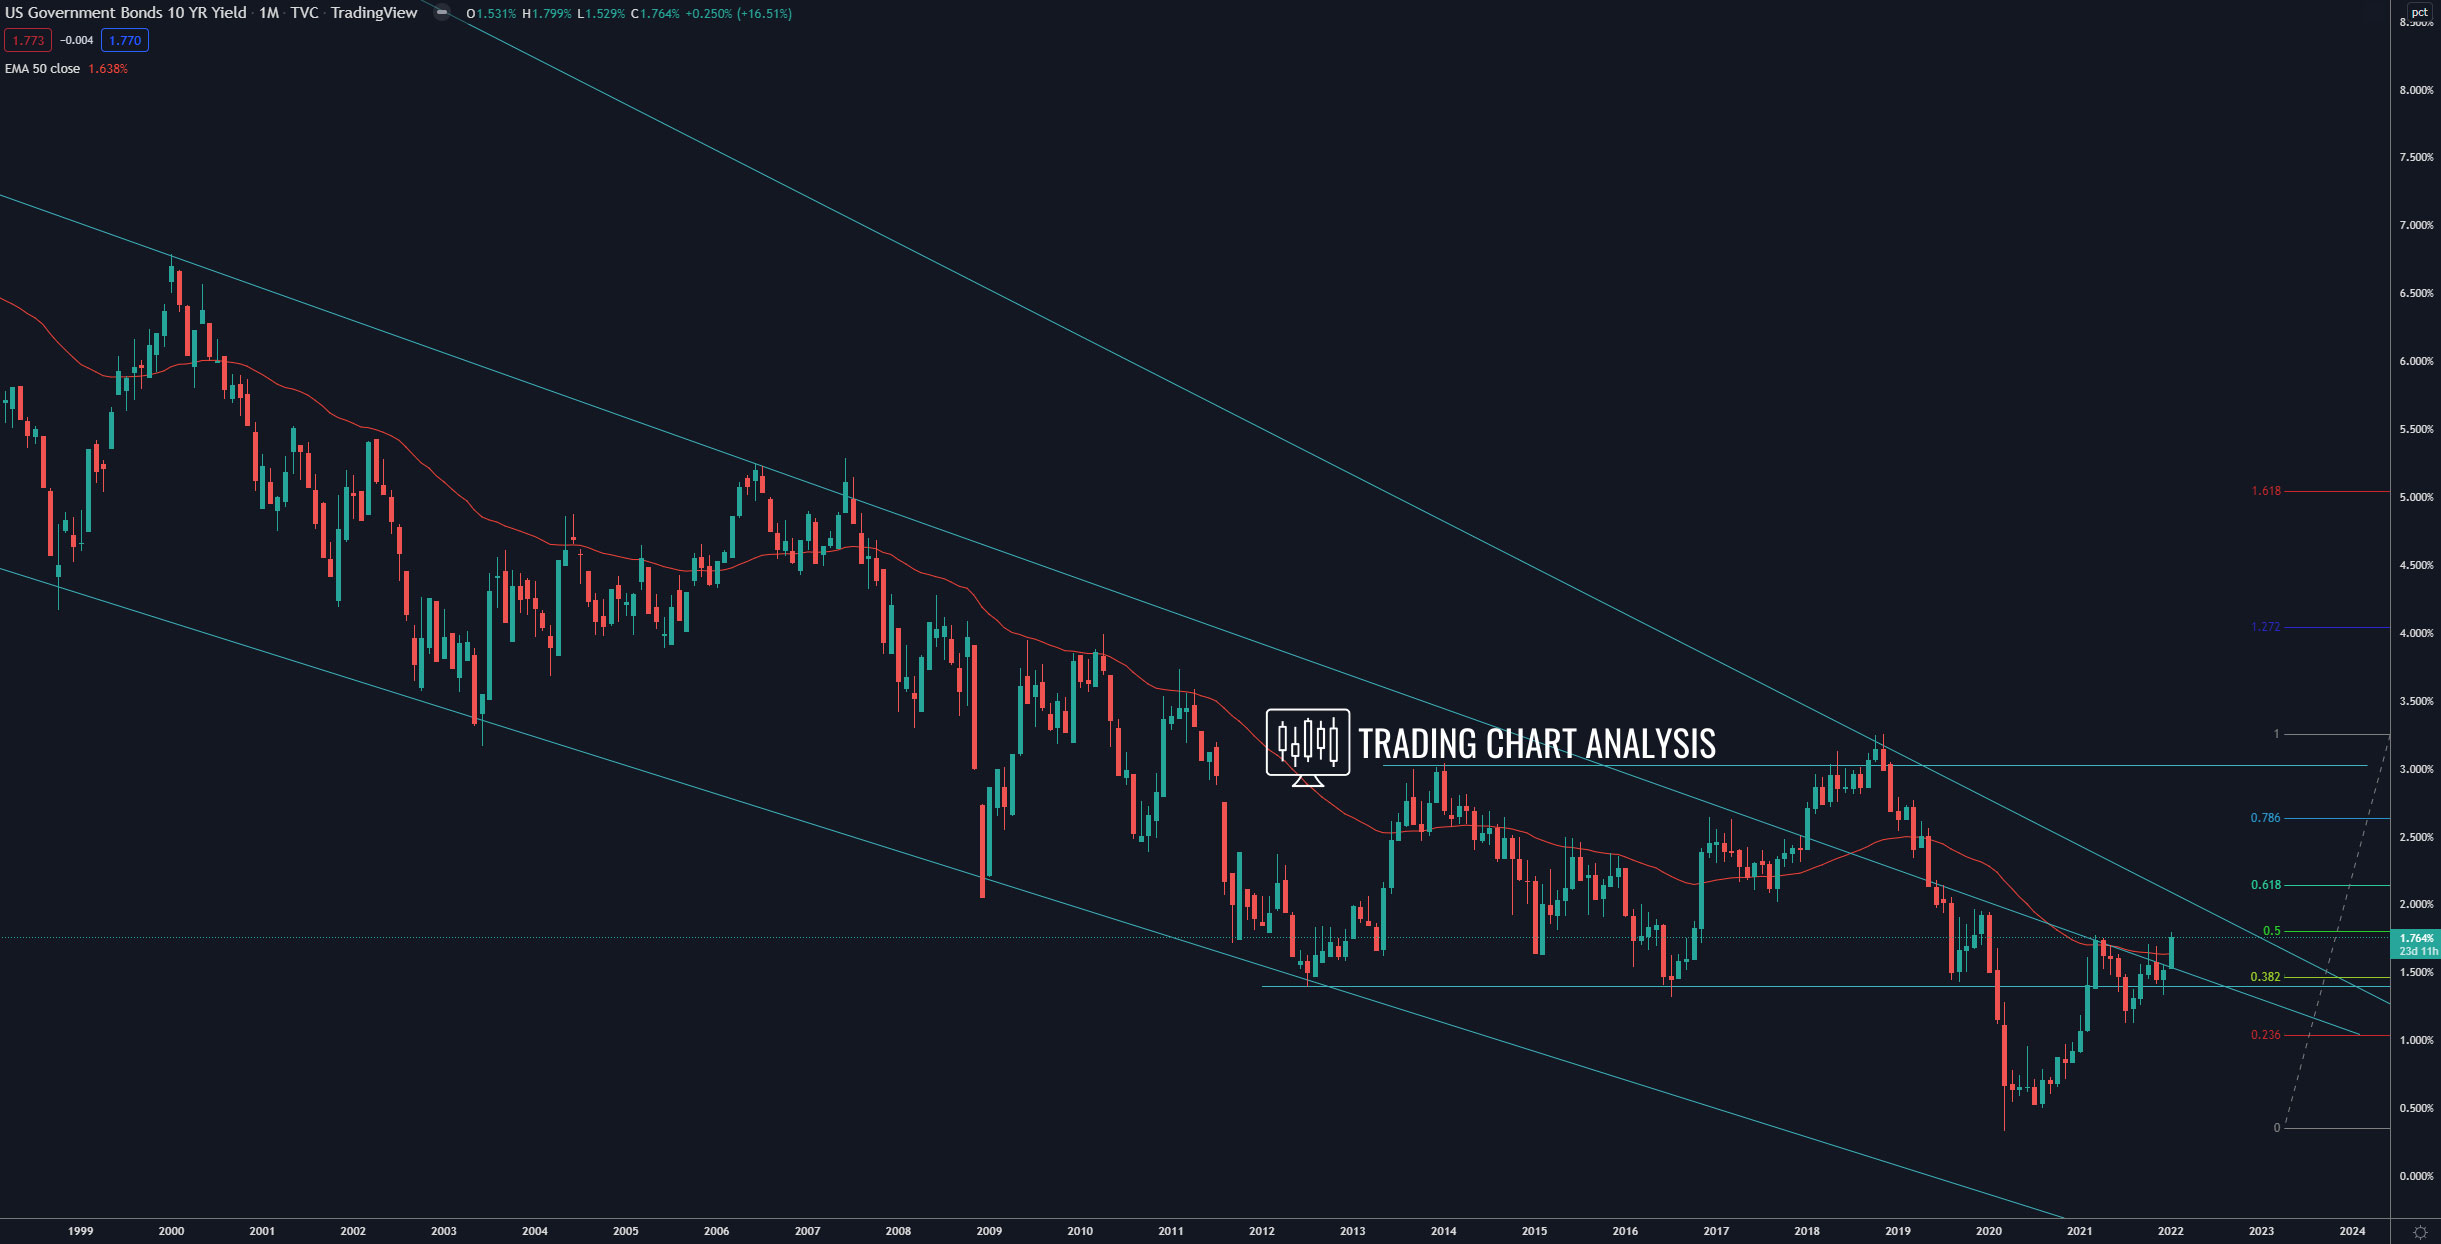
Looking at the monthly chart, if the 10-year US Government bond yield break above the March 2021 high at 1.774%, it will open the door for a bullish run. The first target for this potential bullish break-out is the 0.618 FIB retracement on the monthly chart at 2.15%. The second target is the 1.272 FIB extension at 2.95-3.00%. The third target is the 1.618 FIB extension at 3.45%.
The key supports to watch throughout the year are the low at 1.336% and the low at 1.127%.
Weekly chart:

Monthly chart: