|
Getting your Trinity Audio player ready...
|
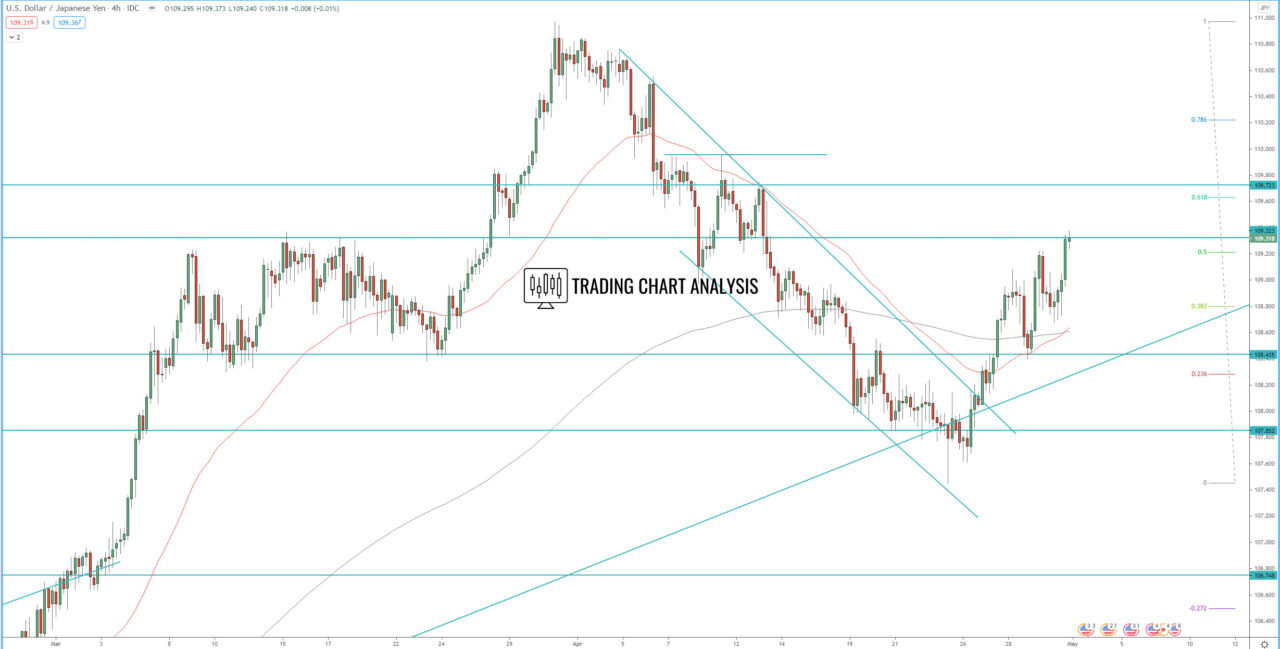
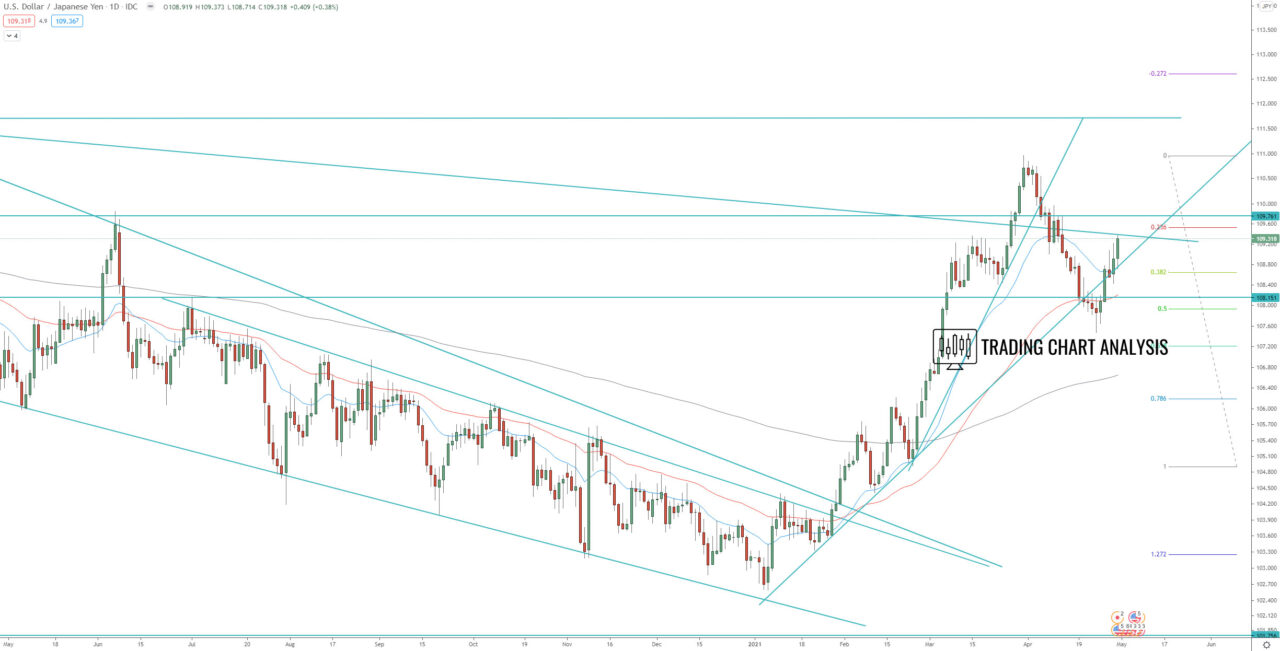
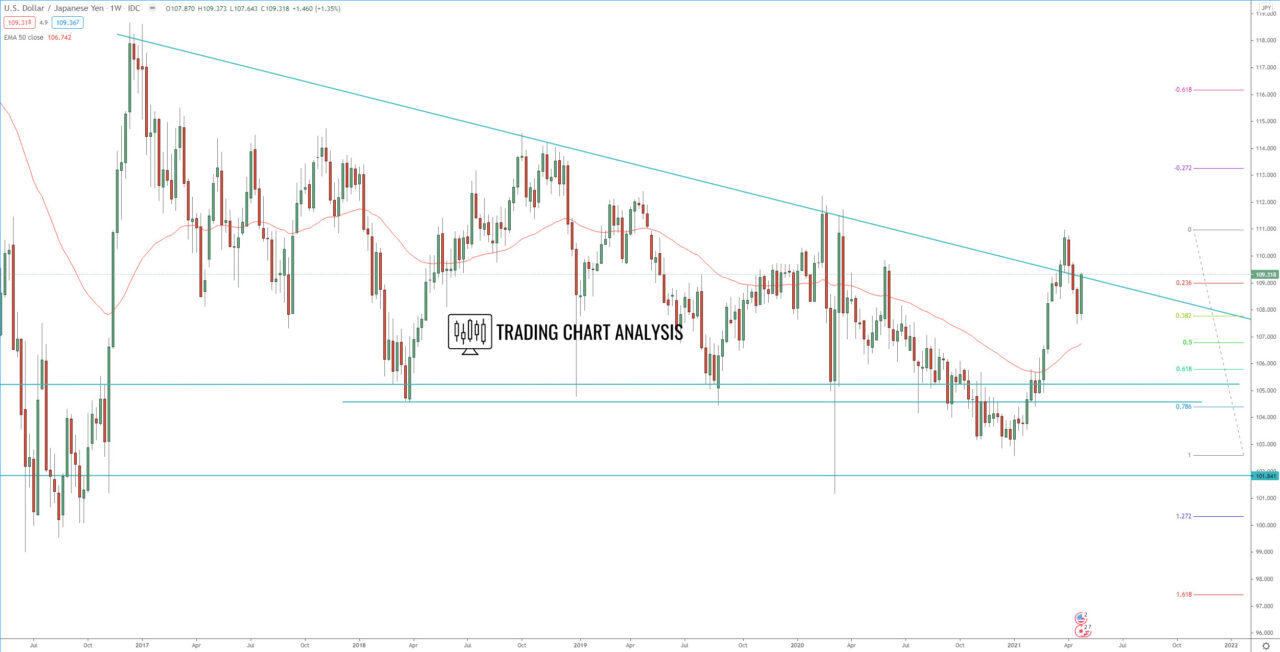
Technical analysis for the USD/JPY is showing that the pair formed a bullish engulfing on the weekly chart, bounced from 0.386 FIB, a signal for resumption of the bullish trend. This bounce materializes as a breakout above descending price channel on the 4H chart. The first target of this breakout is at 1.272 FIB extension at 110.45, the second target is the 1.618 FIB extension at 111.00. If the USD/JPY pair break above 111.00, will be a signal that the USD/JPY pair is heading toward the 112.00 – 112.25 resistance zone.
The previous daily low at 107.47 is now key support for the USD/JPY pair, if the price break below 107.47, it will send the USD/JPY lower toward 106.80 and perhaps toward 105.80.
4H chart:

Daily chart:

Weekly chart:


