|
Getting your Trinity Audio player ready...
|
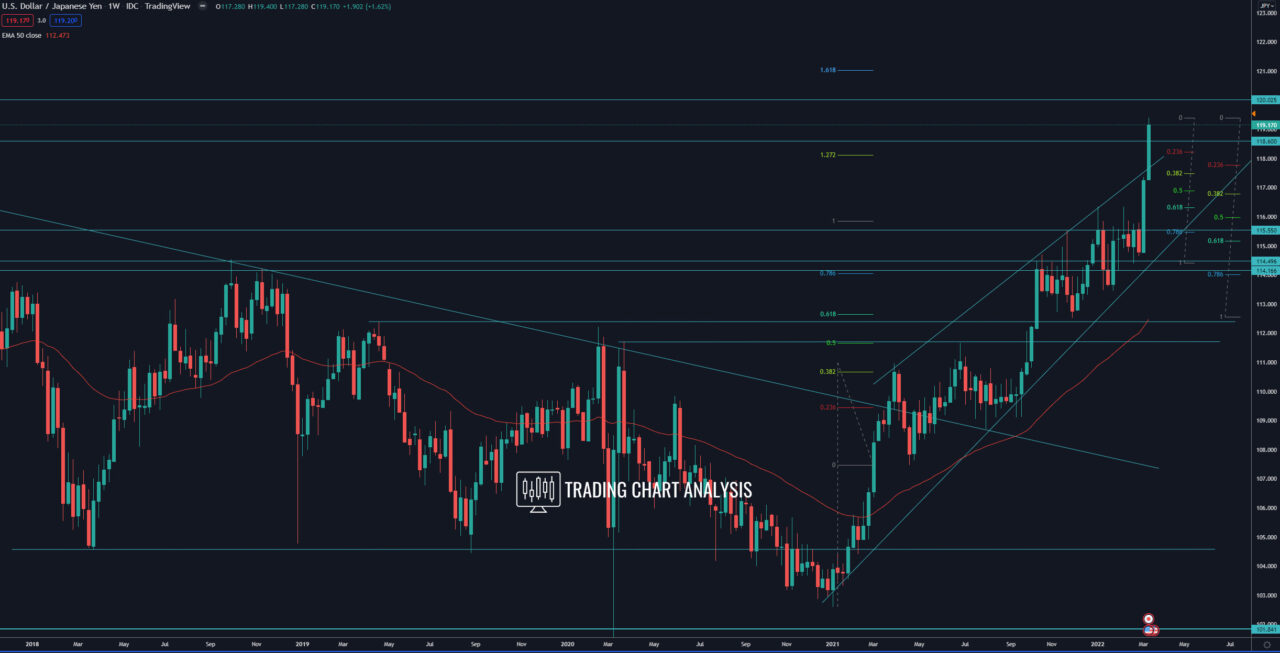
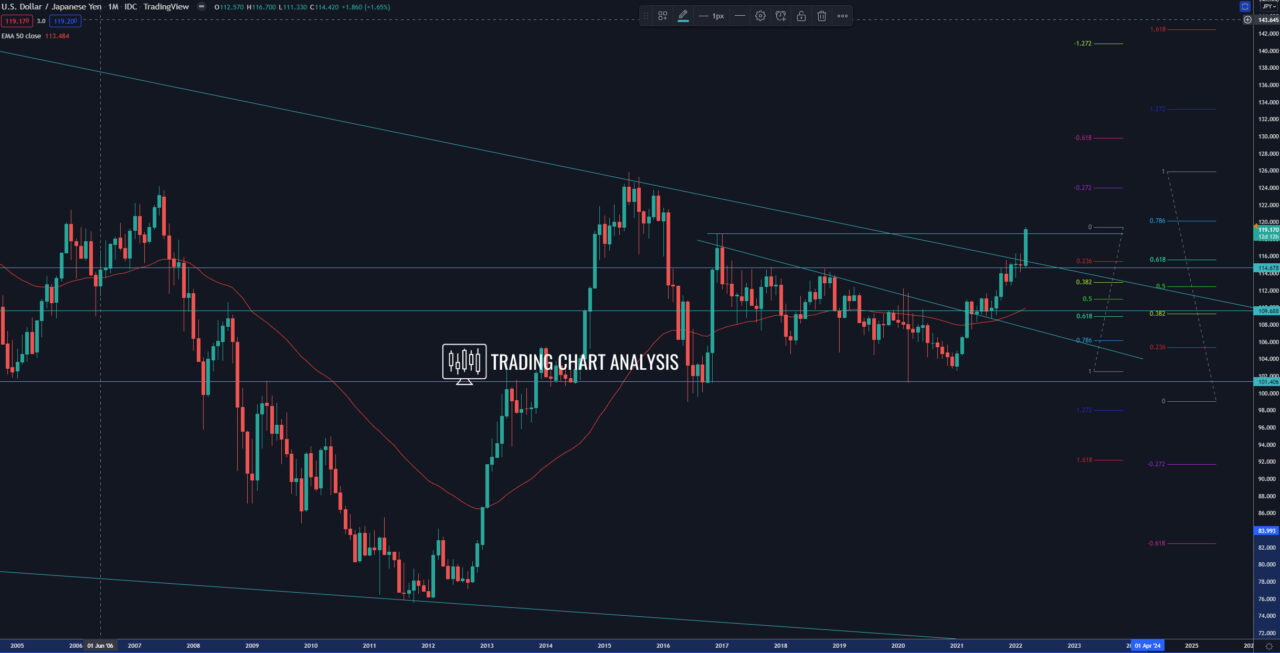
Technical analysis for the USD/JPY, the pair broke above the high at 118.66, which is a key level. The USD/JPY also broke above the long-term descending trend line on the monthly and the weekly chart, confirming the bullish trend. This breakout extends the bullish wave on the weekly chart and opens the door for further upside. The second target of the bullish wave on the weekly chart is the 1.618 FIB extension at 121.00. The third target for the USD/JPY is the high on the monthly chart at 125.85. The fourth target is the 2.272 FIB extension on the weekly chart at 126.50. The fifth target is the 2.618 FIB extension on the weekly chart around 129.50.
The USD/JPY is overbought on both the weekly and the daily chart, and it needs a pullback. The first support level to watch in case of a pullback is the previous resistance, now support at 118.66. The second support is at the low at 117.70. The third is the support zone around 116.40-50.
Weekly chart:

Monthly chart:


