Technical analysis for 7 – 13 February 2021
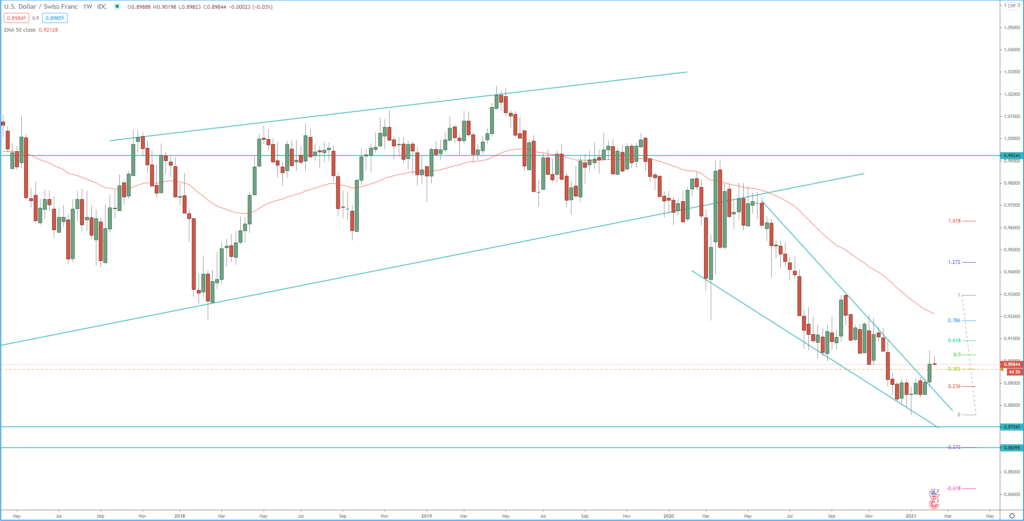
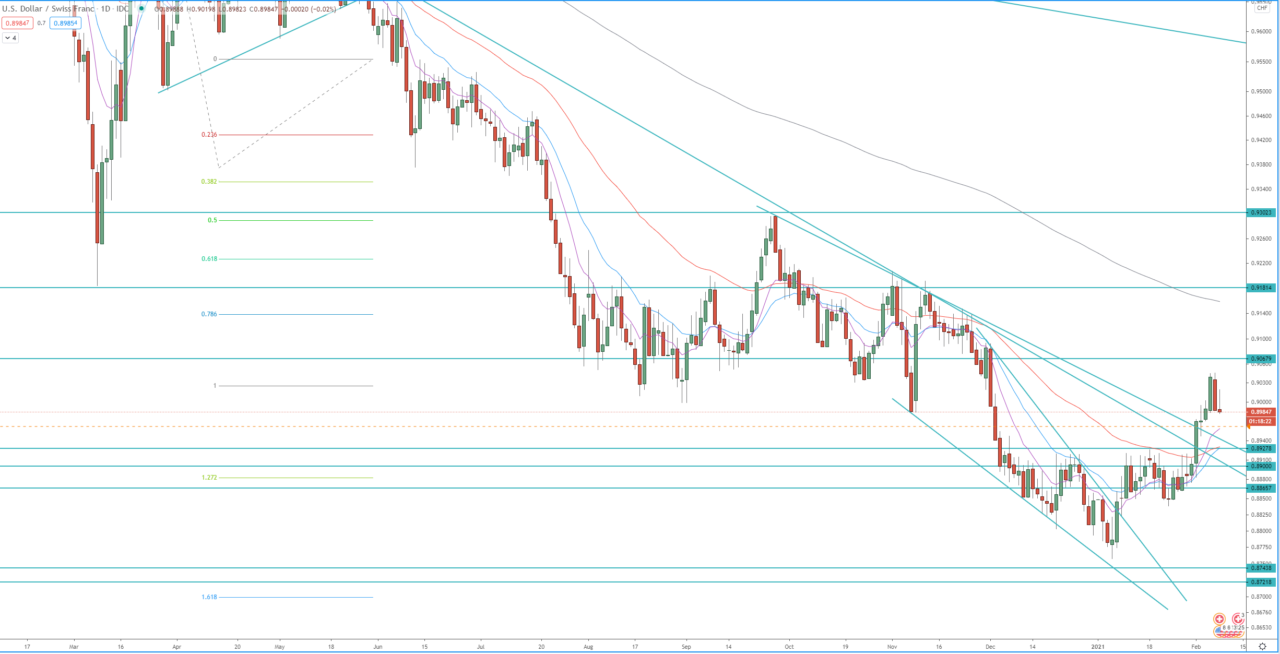
Another USD pair breaking to the upside, last week. The price broke above descending wedge on the weekly chart and above the neckline of a Head and Shoulders pattern on the daily chart. The first target of this daily break up is at 1.272 FIB extension around 0.9050 and it was almost reached last week, second target of that break is at 1.618 FIB extension around 0.9110.
The support zone to be watched for rejection and resumption of this bullish break is between 0.8900 – 0.8930.
Break below the low at 0.8838 will invalidate this bullish run and will resume the bearish trend, with the first target previous low around 0.8760, break below that low will send the price lower toward 0.8700.
Weekly chart:

Daily chart:


