|
Getting your Trinity Audio player ready...
|
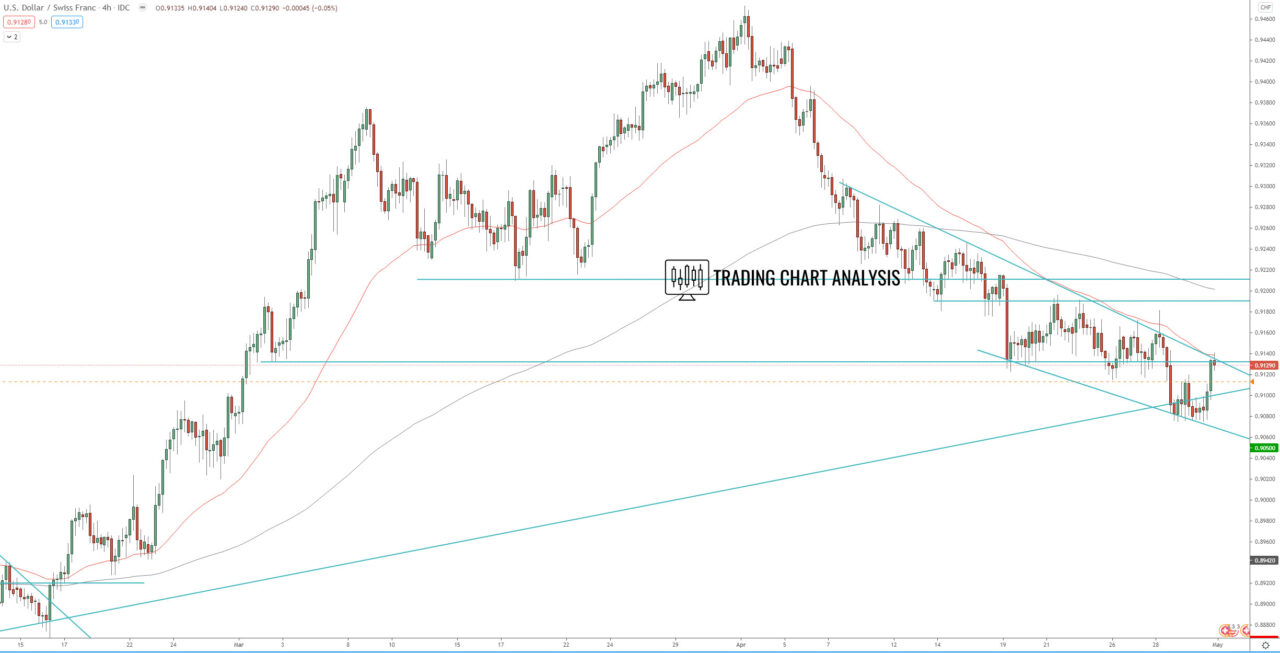
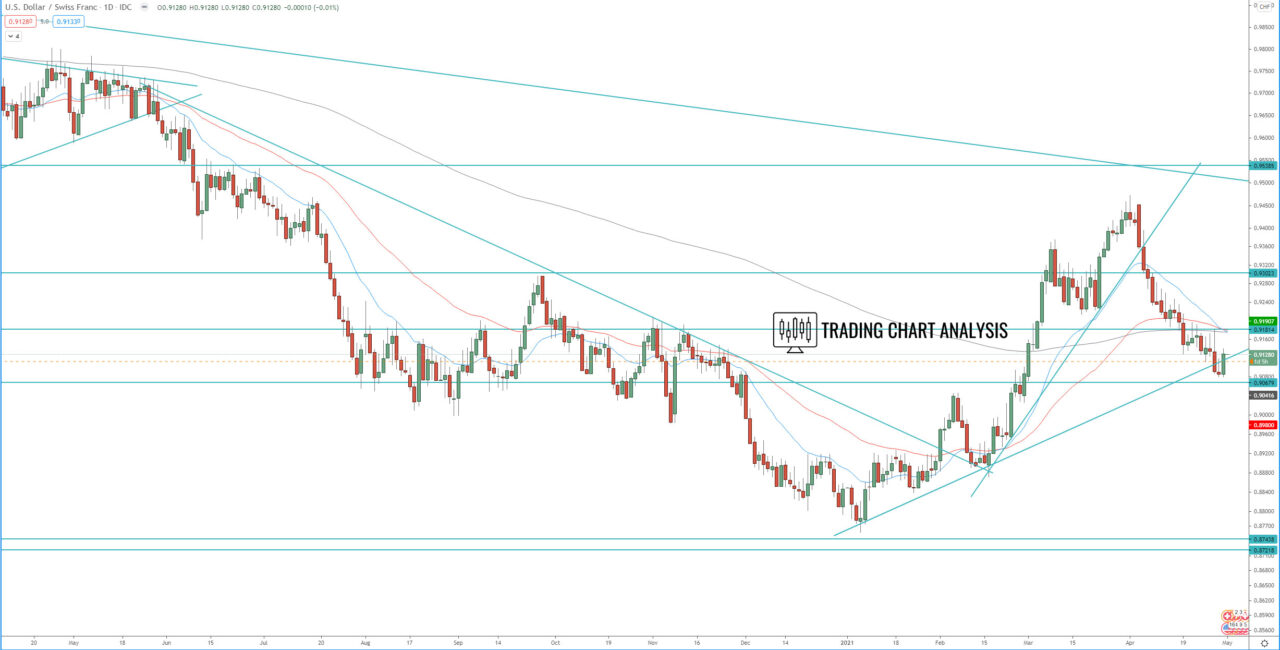
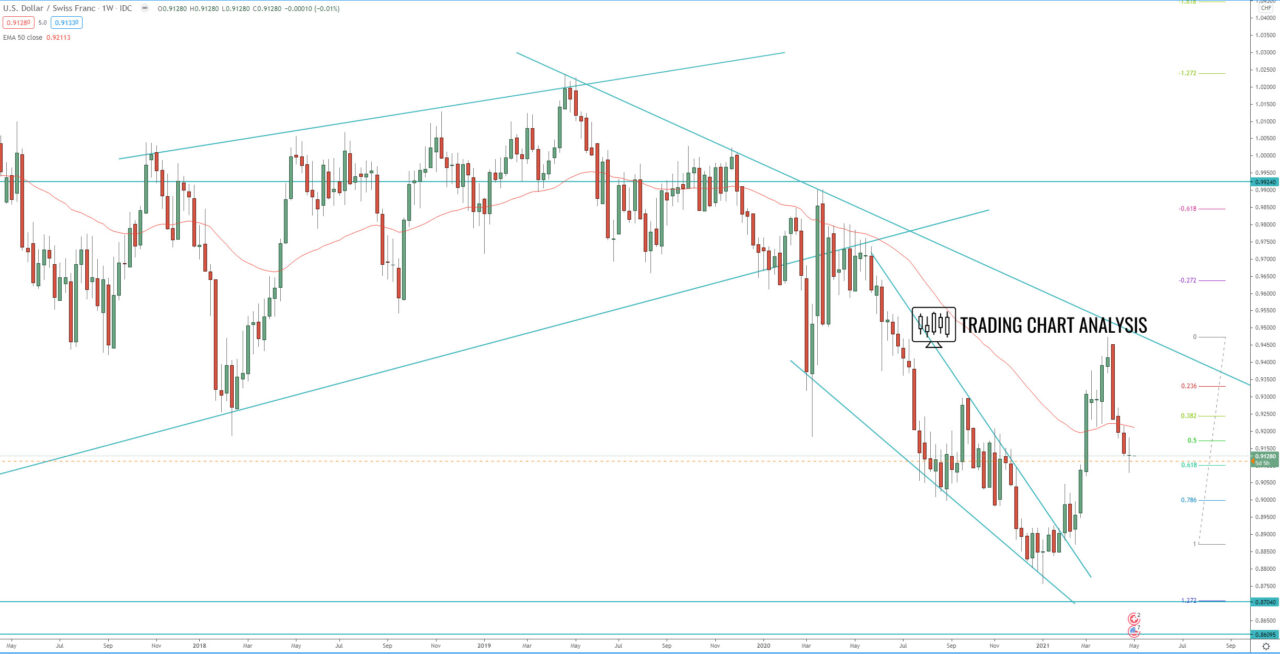
Technical analysis for the USD/CHF is showing that the pair bounce from a support zone and 0.618 FIB retracement and closed the week with a Doji candle. On the daily chart, the USD/CHF pair closed with a bullish engulfing candle, an early signal for a resumption of the bullish weekly trend. The focus for the week ahead is on the descending price channel on the 4H chart, if the price break above it, it will be a confirmation for resumption of the weekly bullish trend. If the USD/CHF pair breaks above the 4H descending price channel, it will send the price toward the 0.386 FIB retracement at 0.9225 and resume the weekly bullish trend.
On the other hand, if the USD/CHF pair break below last week’s low at 0.9075 it may send the price lower. However, the support zone between 0.9025 – 0.9075 should provide the support that will lead to the resumption of the bullish weekly trend.
4H chart:

Daily chart:

Weekly chart:


