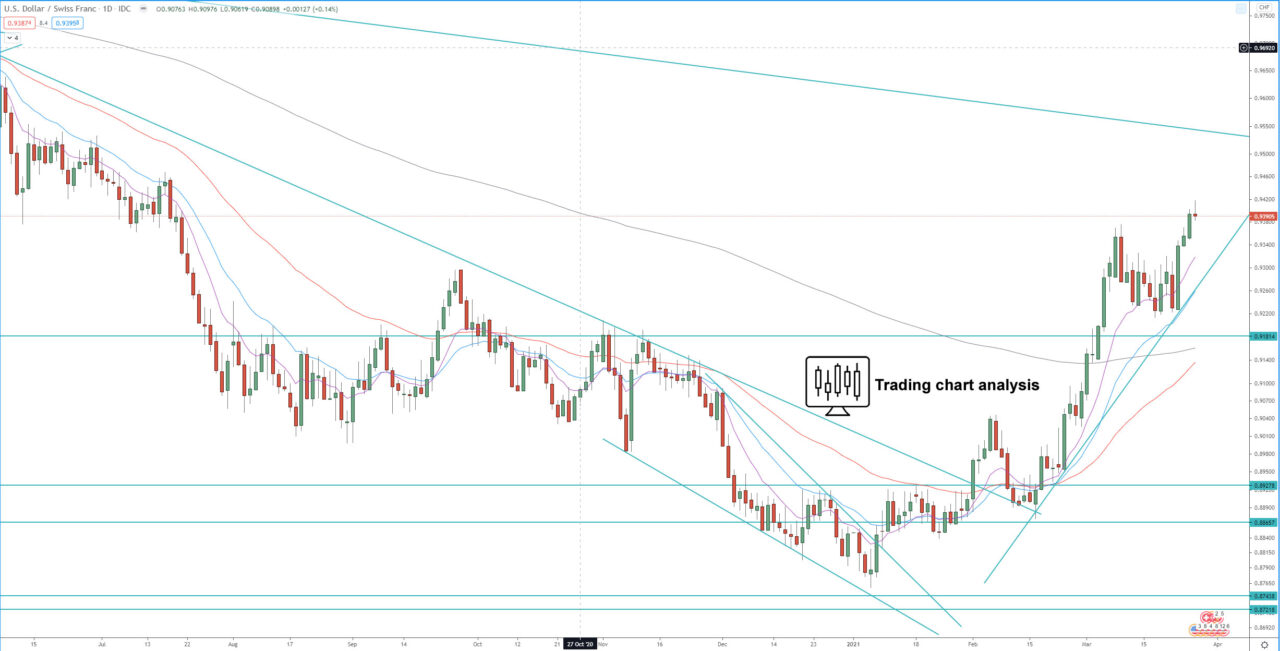
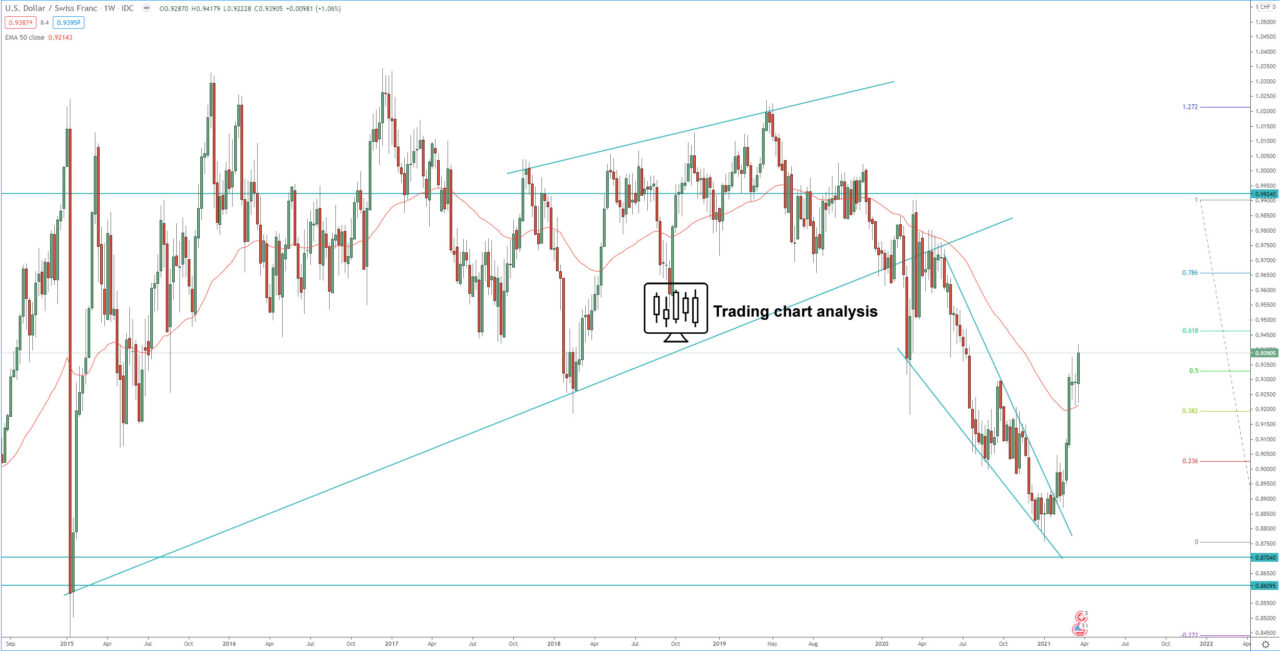
Technical analysis for the USD/CHF pair is showing that after the break above descending wedge on the weekly chart, the price started a new bullish trend on the daily chart. The first target of this bullish run is at 1.618 FIB extension at 0.9335, was reached, the second target for this bullish run is at 2.272 FIB extension at 0.9525, where the price will face dynamic and horizontal resistance, break above it will accelerate the bullish momentum toward 0.9625.
The support zone between 0.9220 – 0.9180, should be monitored for rejection and resumption of the bullish trend for the USD/CHF.
Daily chart:

Weekly chart:


