|
Getting your Trinity Audio player ready...
|
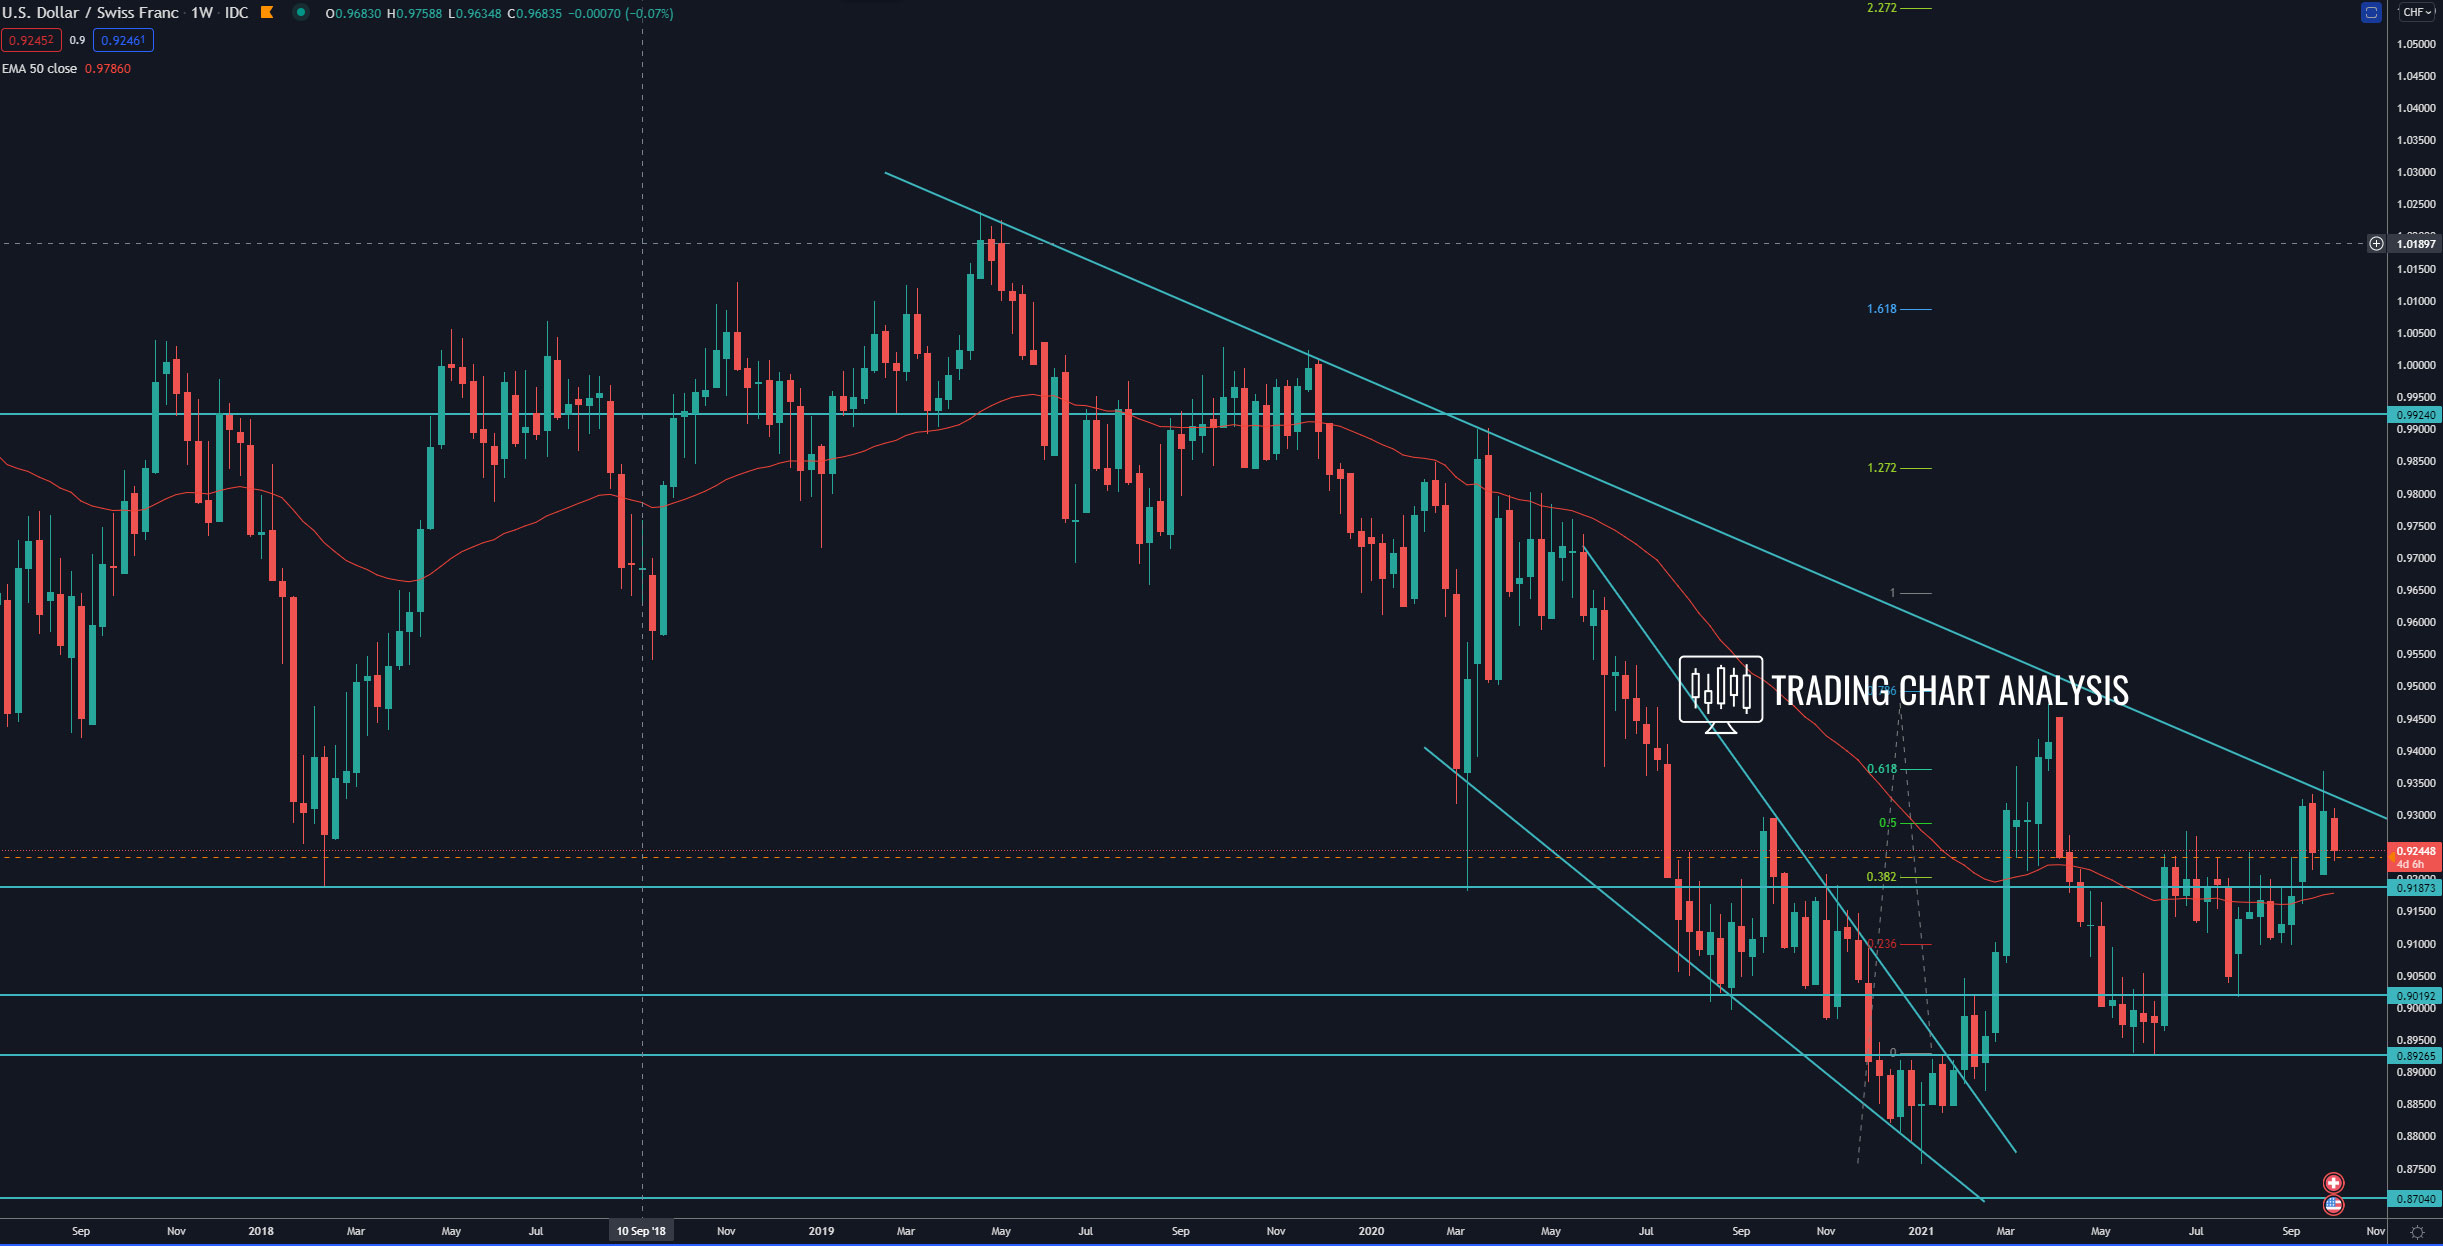
Technical analysis for the USD/CHF, the pair broke above the weekly high at 0.9275. This breakup opens the door for a bullish run toward the previous weekly high at 0.9472. Furthermore, if the pair eventually break above 0.9472, it will send the USD/CHF higher toward first the 100 FIB extension on the weekly chart at 0.9650 and second toward the 1.272 FIB extension at 0.9840.
The support zone between 0.9180 – 0.9225 is a key support zone now and should provide a bullish pressure.
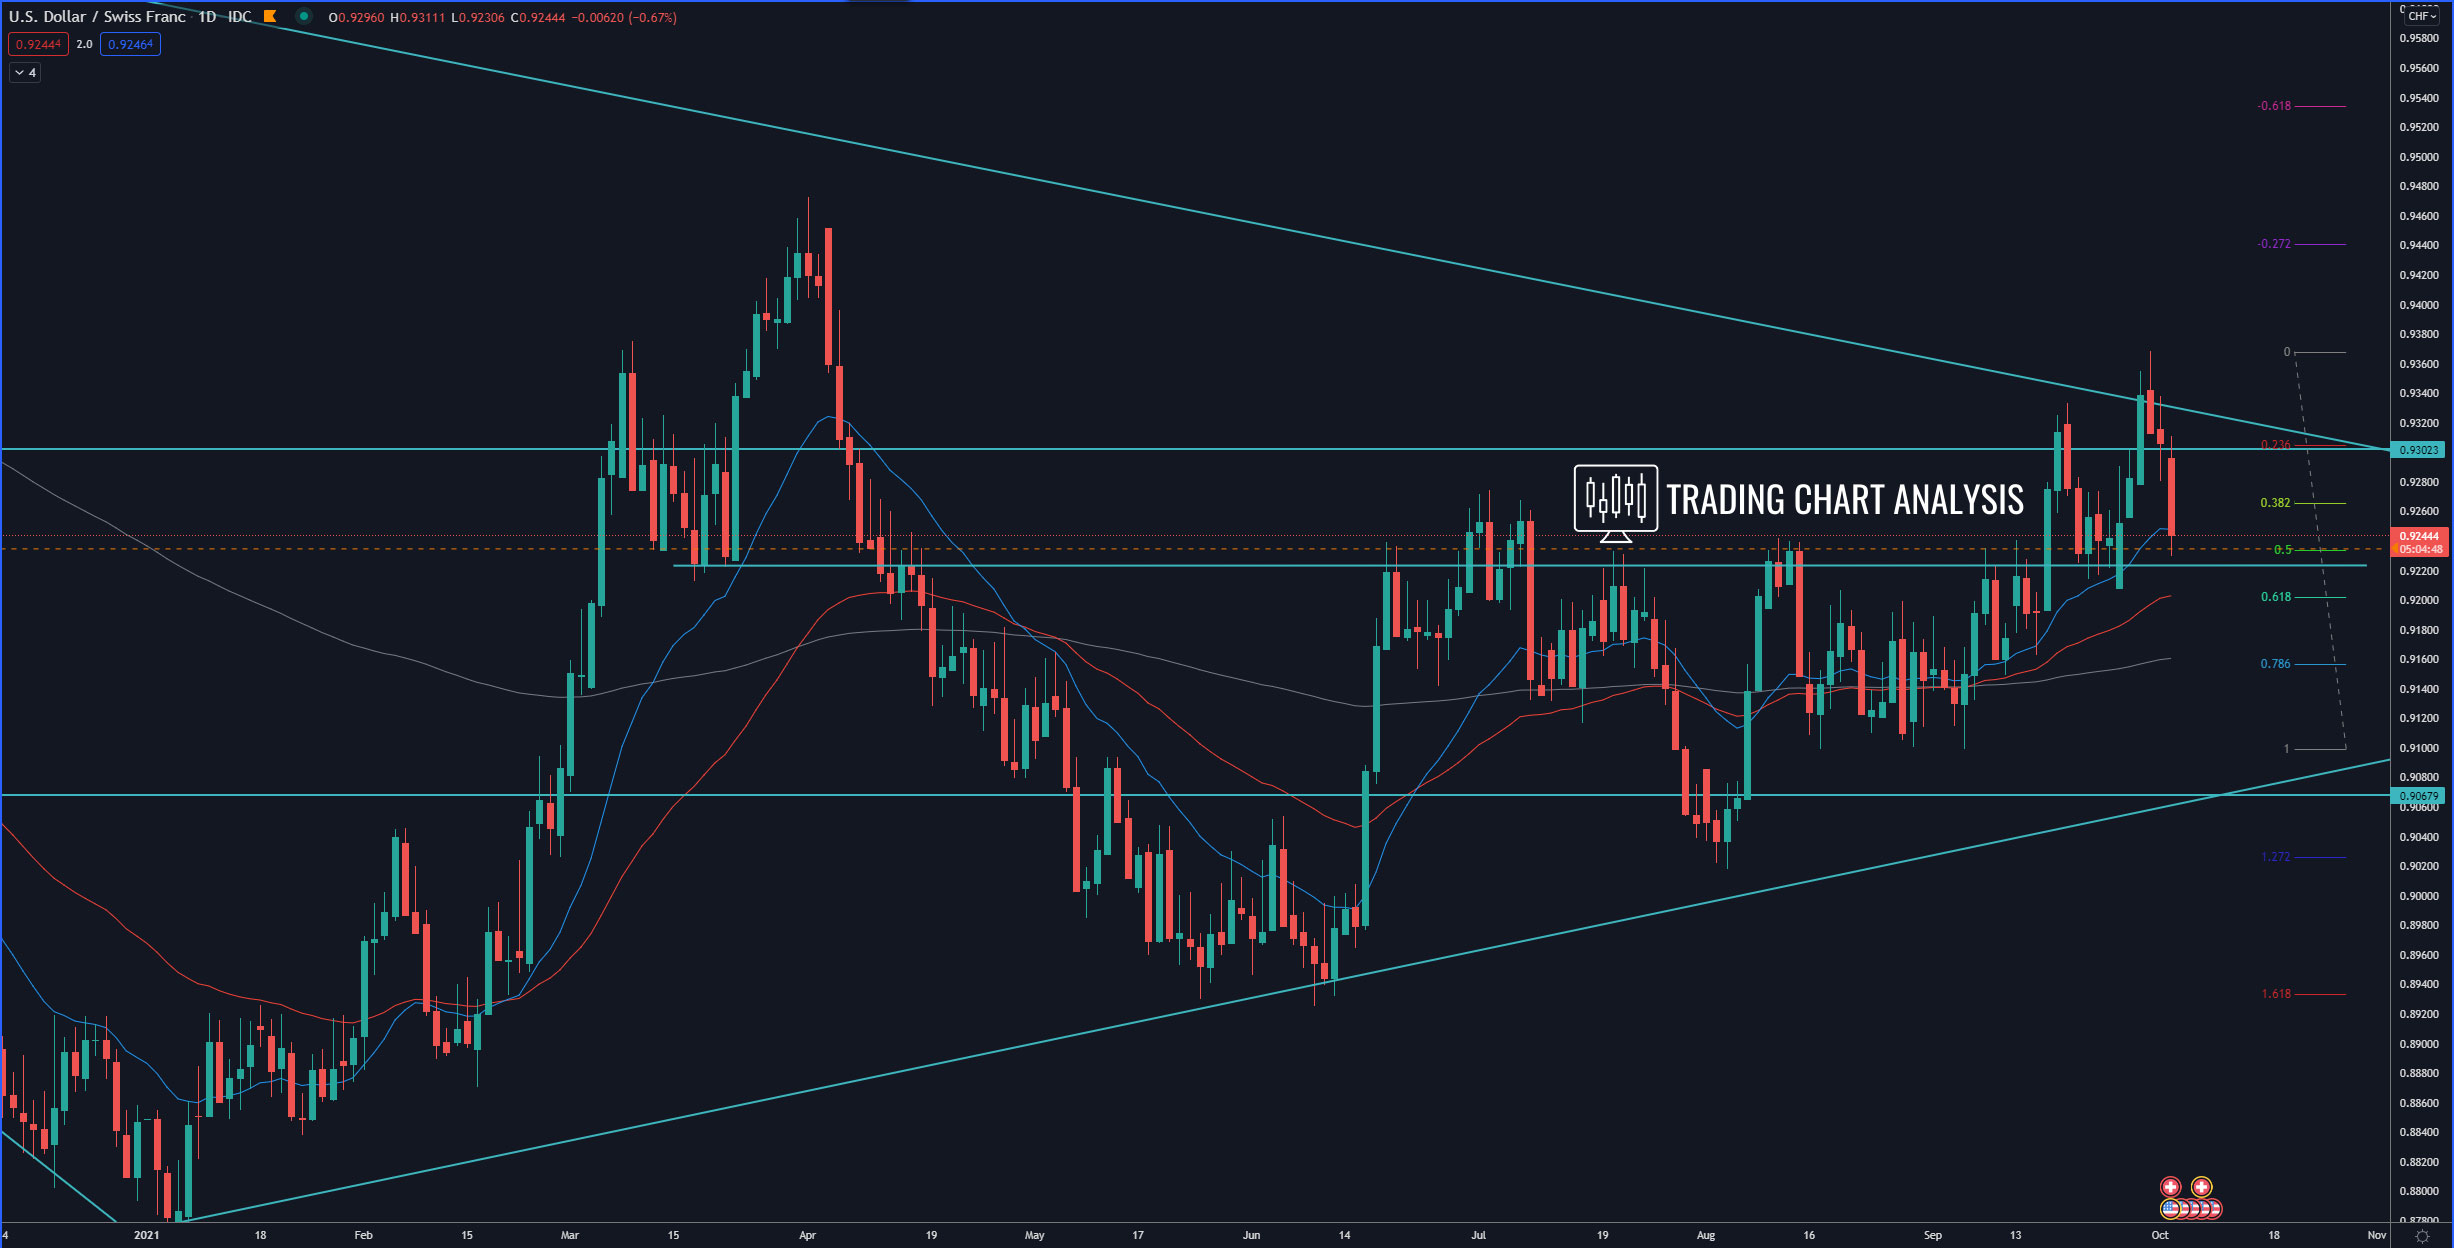
On the other hand, the bullish pressure on the USD/CHF eased at resistance, the descending trend line. And the rally from 0.8926 to 0.9368 can be viewed as a corrective one.
Daily chart:
Weekly chart: