|
Getting your Trinity Audio player ready...
|
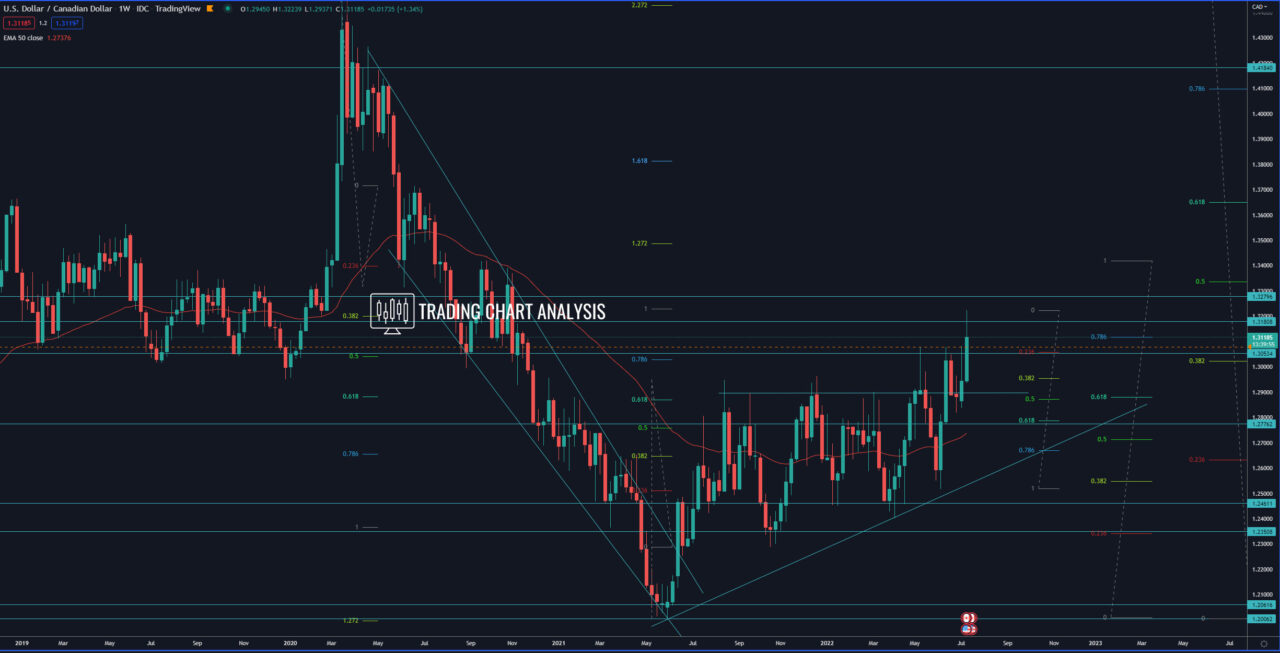
Technical analysis for USD/CAD, the pair broke out above a six months resistance, above the double tops on the daily chart, and above the 0.382 FIB retracement on the weekly chart at 1.3020, starting a bullish run. The first target for this breakout is the 0.500 FIB retracement on the weekly chart at 1.3335. The second target for the bullish run in USD/CAD is the 1.272 FIB extension on the weekly chart at 1.3485. The third target is the 0.618 FIB retracement on the weekly chart at 1.3650.
On the other hand, on the weekly chart, the USD/CAD was not able to close above the six months resistance, which is a false breakout on the weekly chart. The focus now is on the support zone at 1.2937, a break below it sends the USD/CAD lower toward the support at 1.2840.
If we see a closing above 1.3075 on the weekly chart, that will start a bullish wave on the weekly chart for the USD/CAD, and open the door for a bullish run toward the 0.5000 FIB retracement at 1.3335.
Weekly chart:

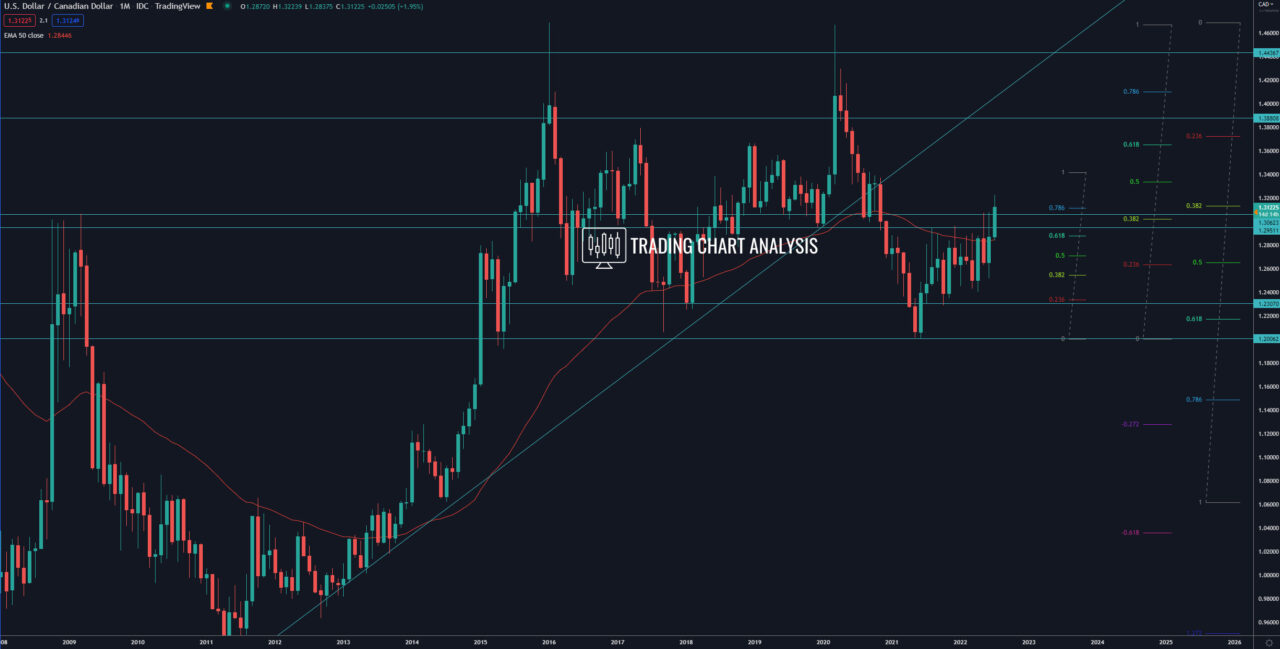
Monthly chart:


