|
Getting your Trinity Audio player ready...
|
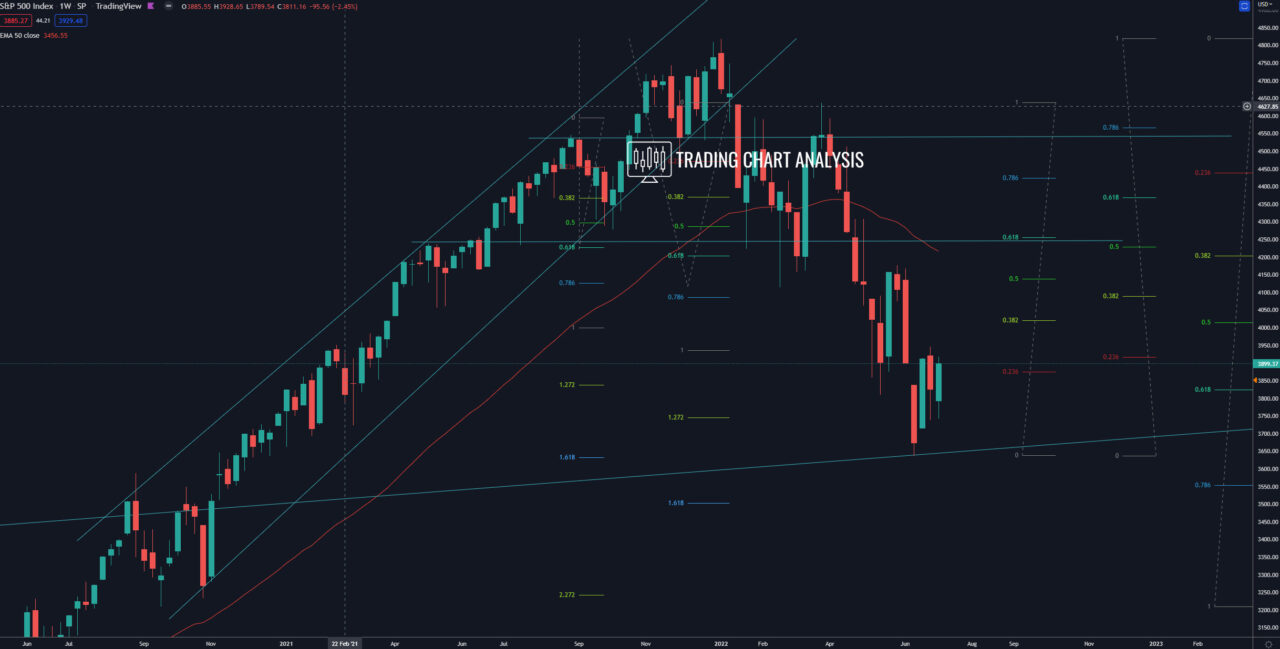
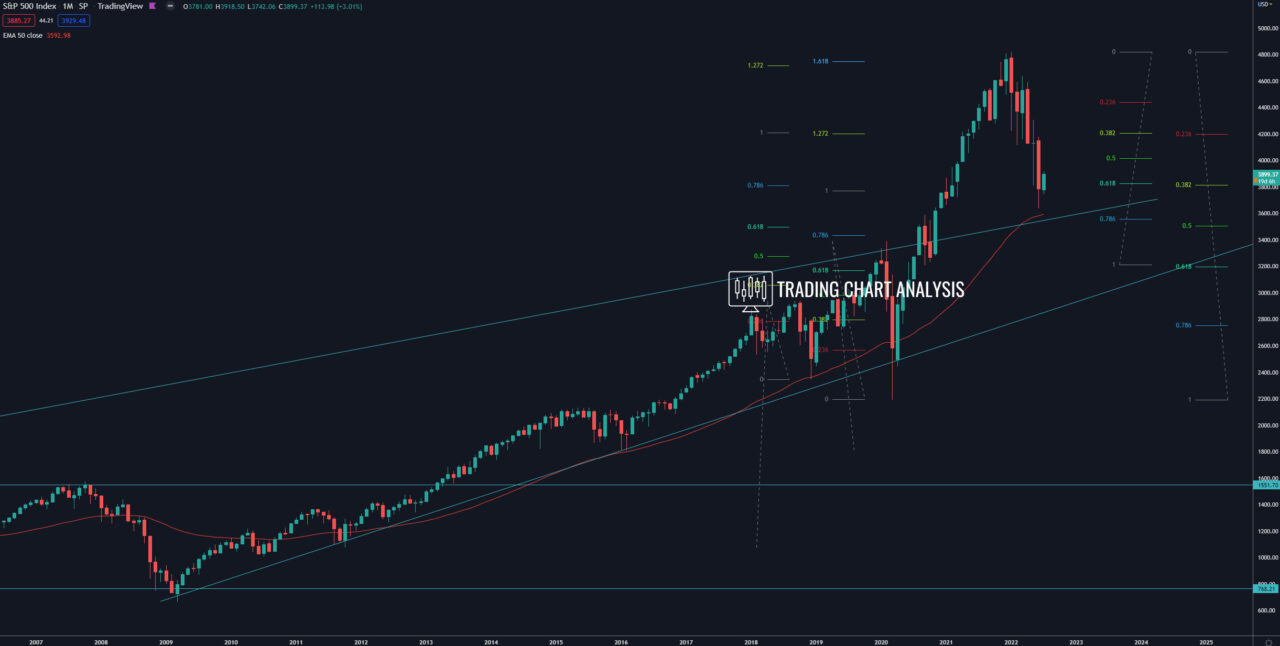
Technical analysis for S&P 500, the index reached the first target of the bearish wave on the weekly chart, the 0.618 FIB retracement on the weekly chart at 3825, which was also the target for the Head and Shoulder on the weekly chart. The S&P 500 index closed below 3825 and 0.618 FIB retracement on the weekly chart and 0.382 FIB retracement the monthly chart, which is a signal for future declines. The first target for this bearish development is the 0.618 FIB retracement on the monthly chart at 3200. The second target is the 2.272 FIB extension on the weekly chart at 3050.
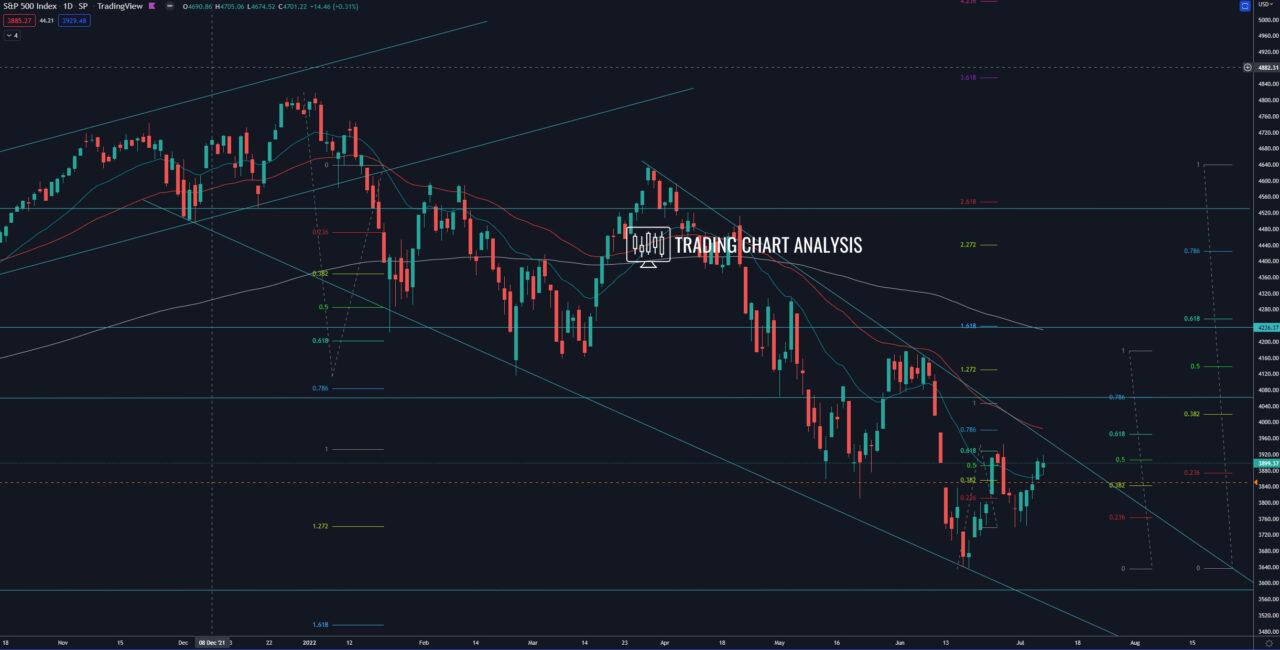
The focus now is on the previous daily high at 3945. If the S&P 500 break above 3945, that will expand the pullback and send the index higher. The first target for this pullback is the 0.618 FIB retracement on the daily chart at 3970, where we have the 50 EMA. The second target for the pullback in S&P 500 is the 0.382 FIB retracement on the weekly chart at 4020. The third target is the 1.272 FIB extension on the daily chart at 4130. The fourth target is the 0.618 FIB retracement on the weekly chart at 4255, where we have the 1.618 FIB extension on the daily chart.
Daily chart:

Weekly chart:

Monthly chart:


