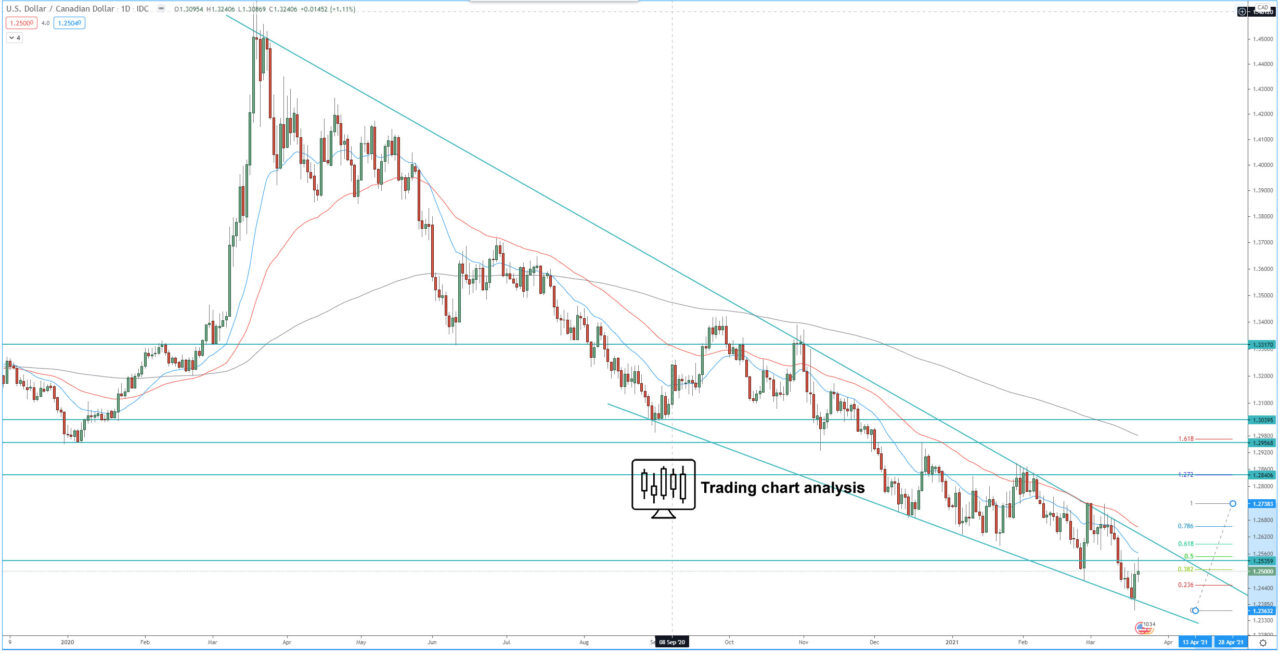
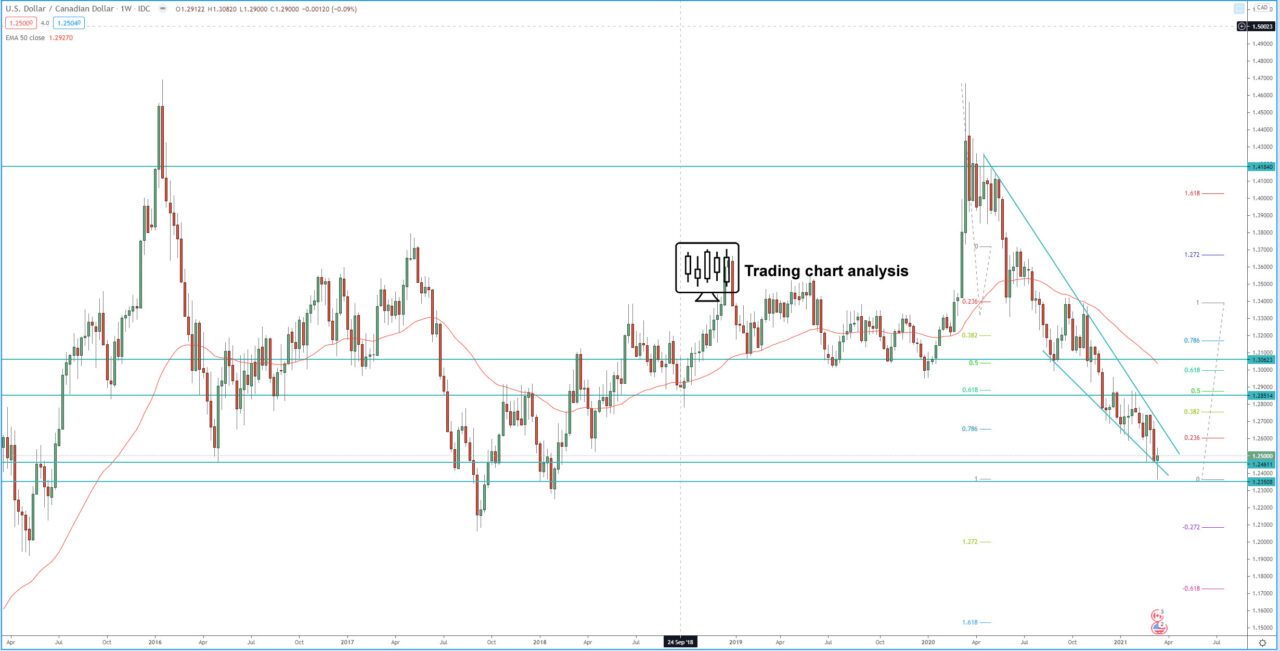
Technical analysis for USD/CAD is showing that the price reached the 2nd target of the 3rd bearish daily wave around 1.2420, it went as low as 1.2365, which is a top of a support zone, and bounce from it starting a pullback on the daily chart. This daily pullback materializes with a low-test candle on the weekly chart bouncing from dynamic and horizontal support.
The price broke out on the 4H chart, the first target of this breakout is between 1.2600 – 1.2620, where we have horizontal and dynamic resistance, 0.618 FIB retracement, and 100% FIB extension for this 4H bullish run. Break above that resistance zone will send the price toward 1.272 FIB extension at 1.2665 and eventually toward 1.618 FIB extension at 1.2725. (We must keep in mind that 1.2550-1.2600 is a strong resistance zone as well, therefore we need to see a break and trade above it to confirm further upside.)
On the other hand, a break below 1.2450 should send the price back toward the previous low at 1.2365, and if we see a break below 1.2365 , it will send the price toward 1.272 FIB extension of the 3rd weekly bearish wave at 1.2000.
Daily chart:

Weekly chart:

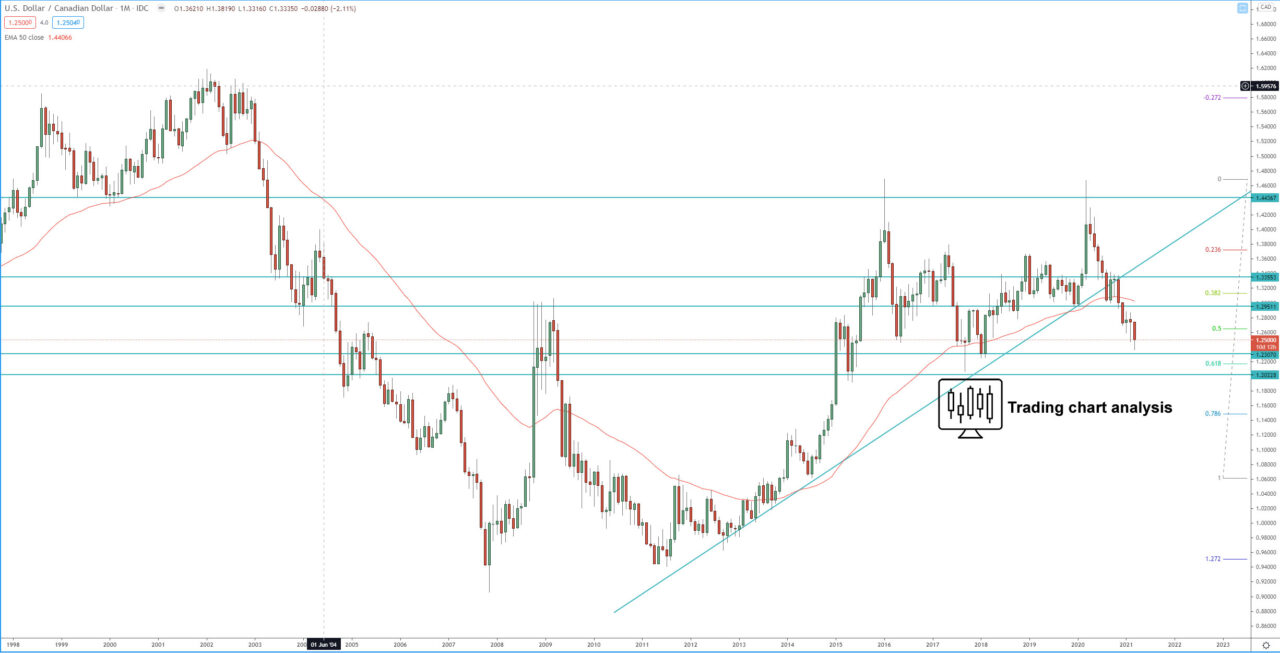
Monthly chart:


