|
Getting your Trinity Audio player ready...
|
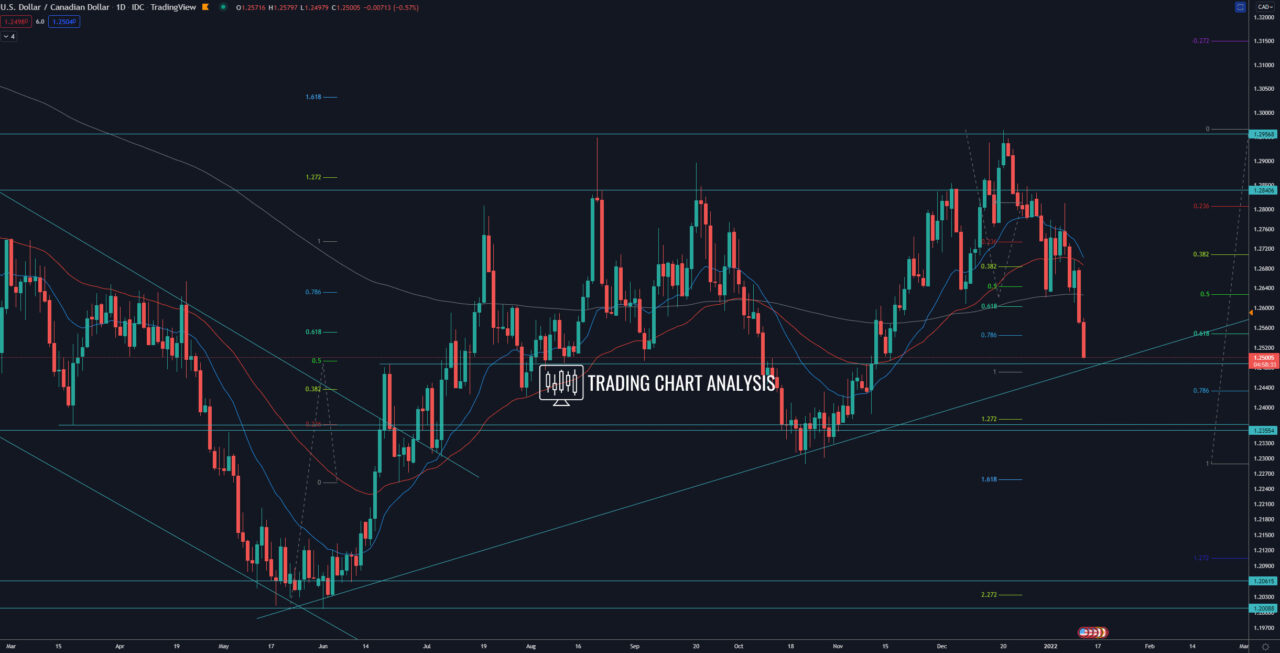
Technical analysis for the USD/CAD, the pair broke below the strong support and a double bottom on the daily chart, below 1.2600-1.2620. This breakout started a bearish run. The first target for the bearish run is the 100% FIB extension on the daily chart at 1.2470, which was hit. The second target is the 1.272 FIB extension on the daily chart at 1.2380. The third target for the bearish run for the USD/CAD is the 1.618 FIB extension on the daily chart at 1.2260. That is just below the key weekly low at 1.2288.
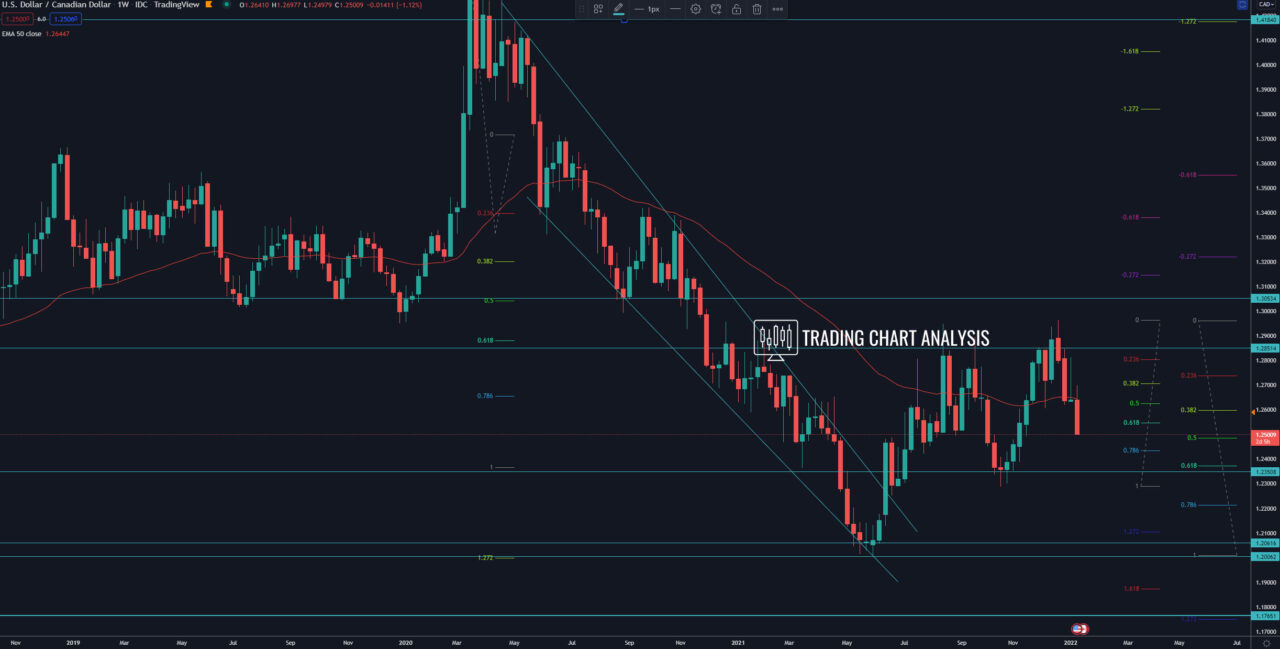
The weekly low at 1.2288 is key support, and if the USD/CAD breaks below it, that will open the door for a bearish run toward the 1.2000.
The resistance zone for the USD/CAD, which one should watch for selling pressure, is between 1.2600 – 1.2635.
Daily chart:

Weekly chart:


