|
Getting your Trinity Audio player ready...
|
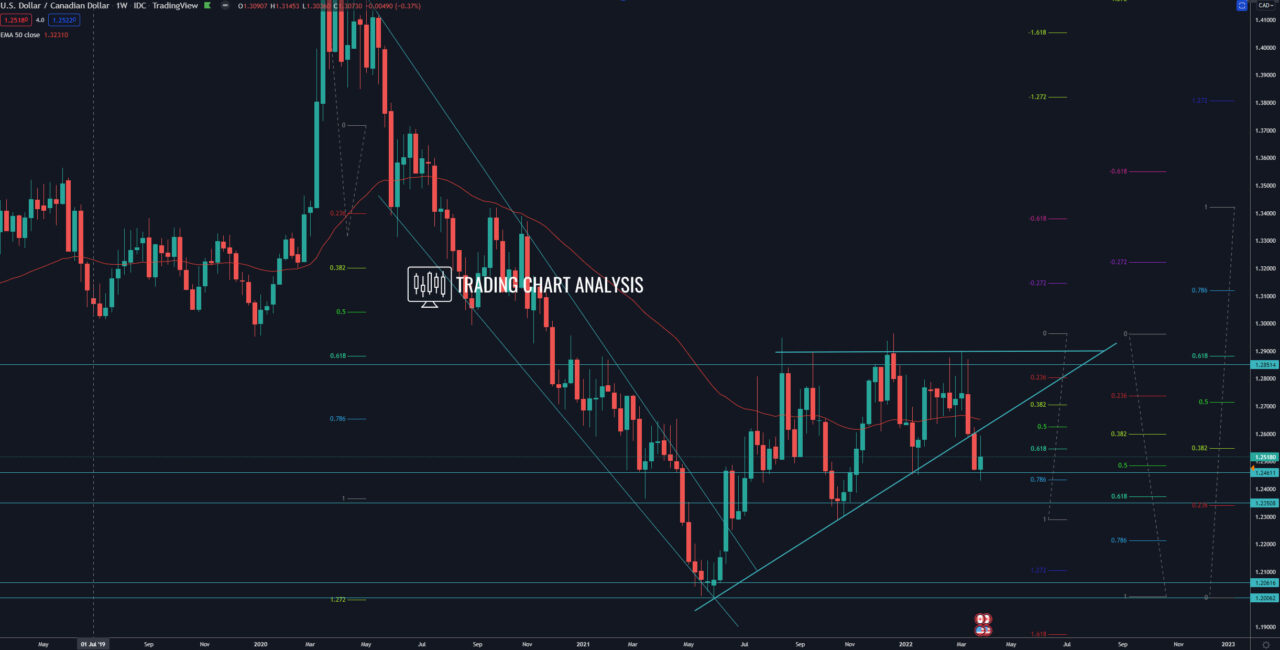
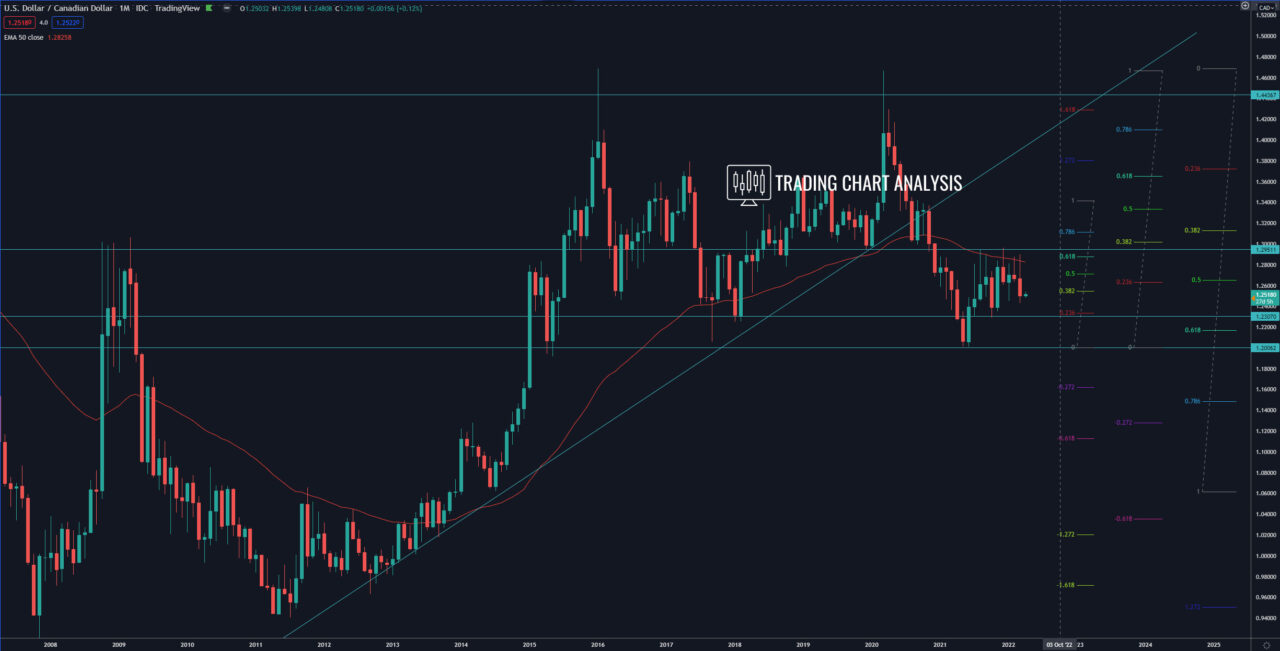
Technical analysis for the USD/CAD, the pair broke below the ascending triangle on the weekly chart. The first target for this breakout, the previous weekly low at 1.2450, was reached. If the USD/CAD pair close below 1.2450 that will open the door for a bearish run toward the low on the weekly chart at 1.2288. And a break below 1.2288 will send the USD/CAD lower to retest the low at 1.2007.
The USD/CAD formed a morning star pattern on the daily chart and closed the week with a bullish inside bar, starting a pullback. The first target for this pullback is the 0.382 FIB retracement on the daily chart around 1.2600. The second target is the resistance zone between the weekly 50 EMA and the 0.500 FIB retracement on the daily chart between 1.2650-70.
Weekly chart:

Monthly chart:


