|
Getting your Trinity Audio player ready...
|
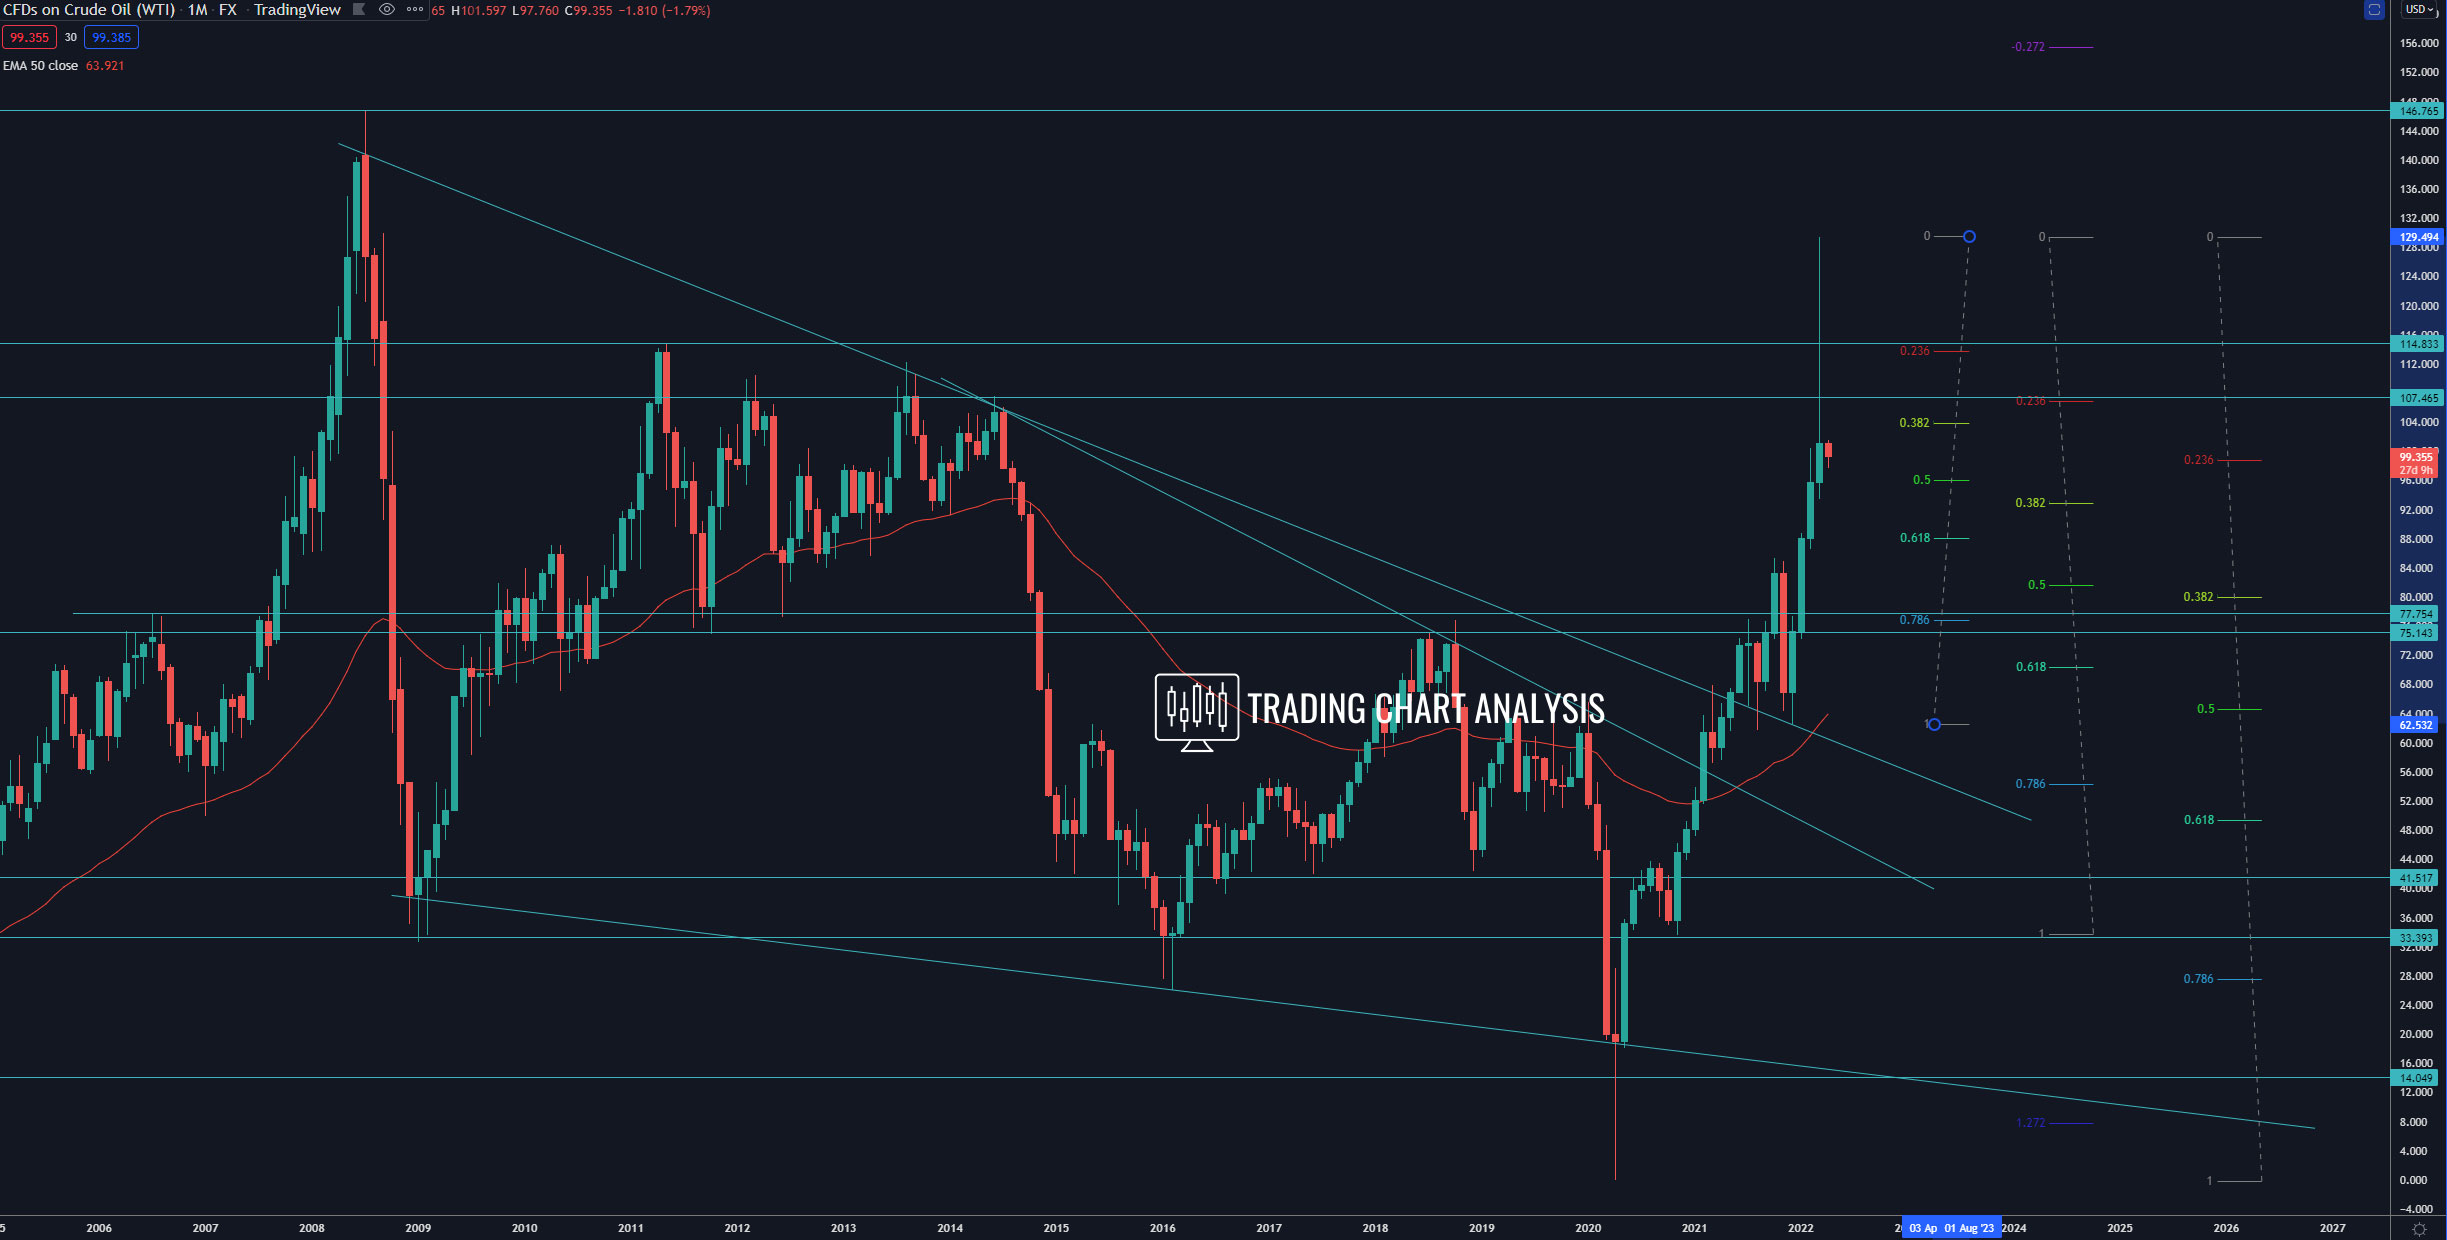
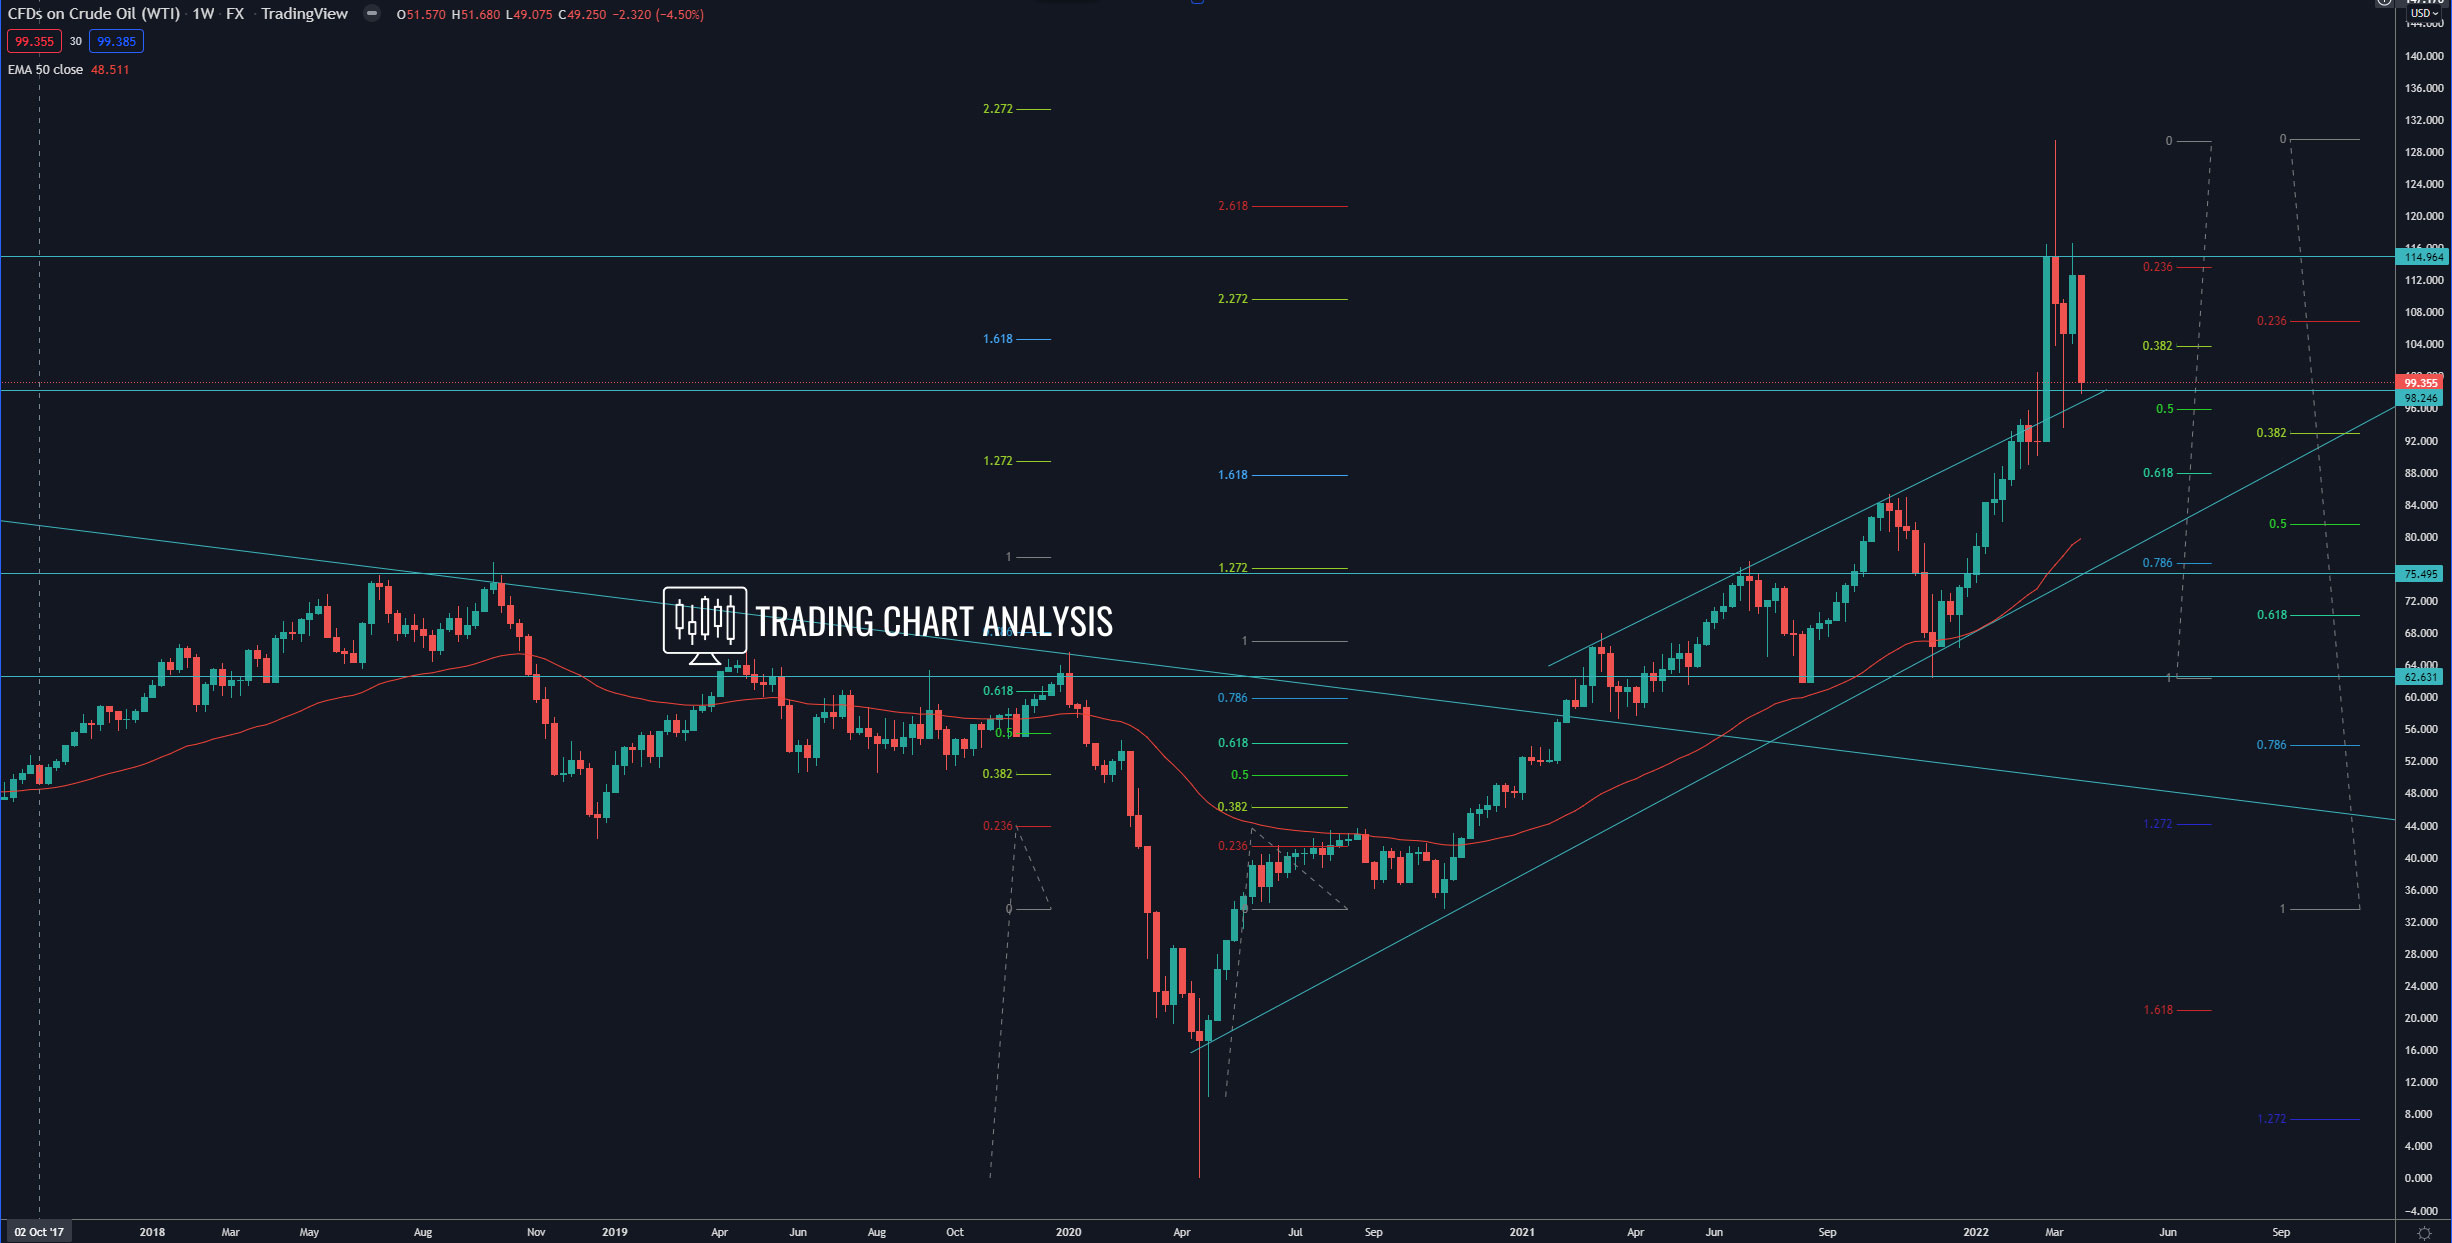
Technical Analysis for the US Crude Oil, the price rejected resistance zone around 115$ with a high-test candle on the monthly chart, starting a pullback. The first target for this pullback, the 0.382 FIB retracement on the weekly chart at 103.75$, was reached. The price of Crude Oil closed below the 0.382 FIB retracement at 103.75$ on the weekly chart, which is a signal for further decline. The second target for the pullback is the 0.618 FIB retracement on the weekly chart at 88.00$, but before that we need to see a break below the daily low at 93.50$.
On the other hand, if the price of US Crude Oil breaks above the high on the daily chart at 116.62$, it will open the door for a bullish run toward the previous high on the daily chart at 129.41$. And if the price of US Crude Oil breaks above 129.41$ on the daily chart it will open the door for a bullish run toward the 2008 high at 146.73$.
Weekly chart:
Monthly chart: