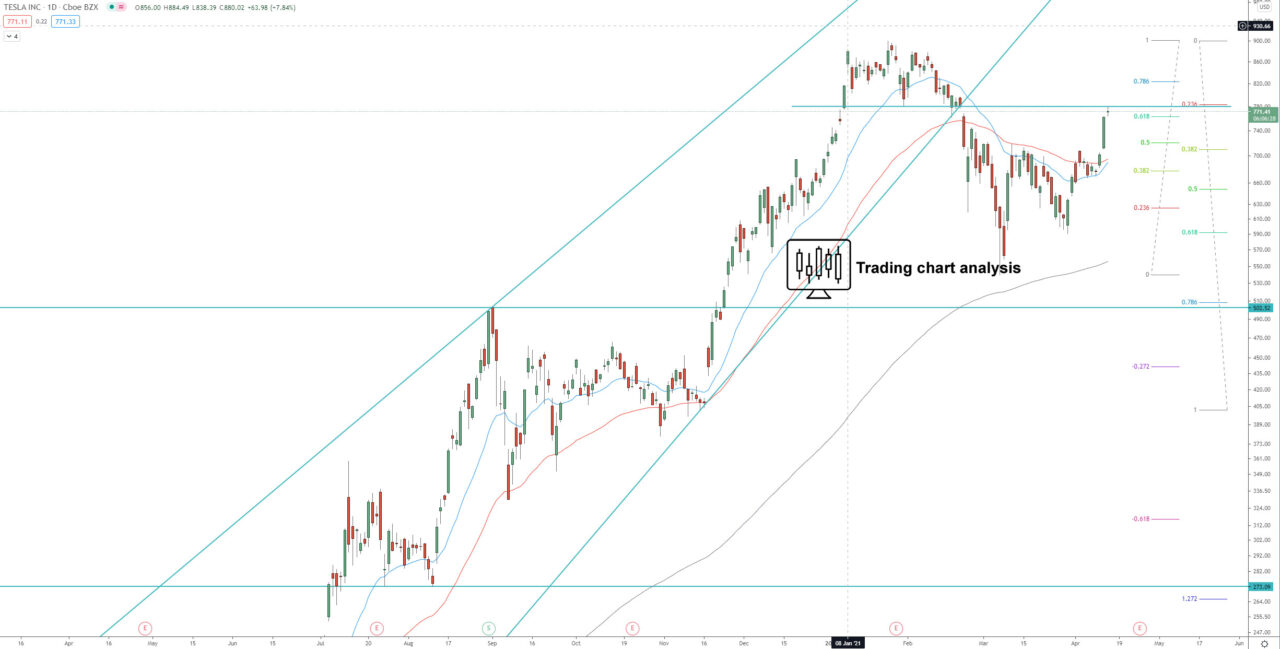
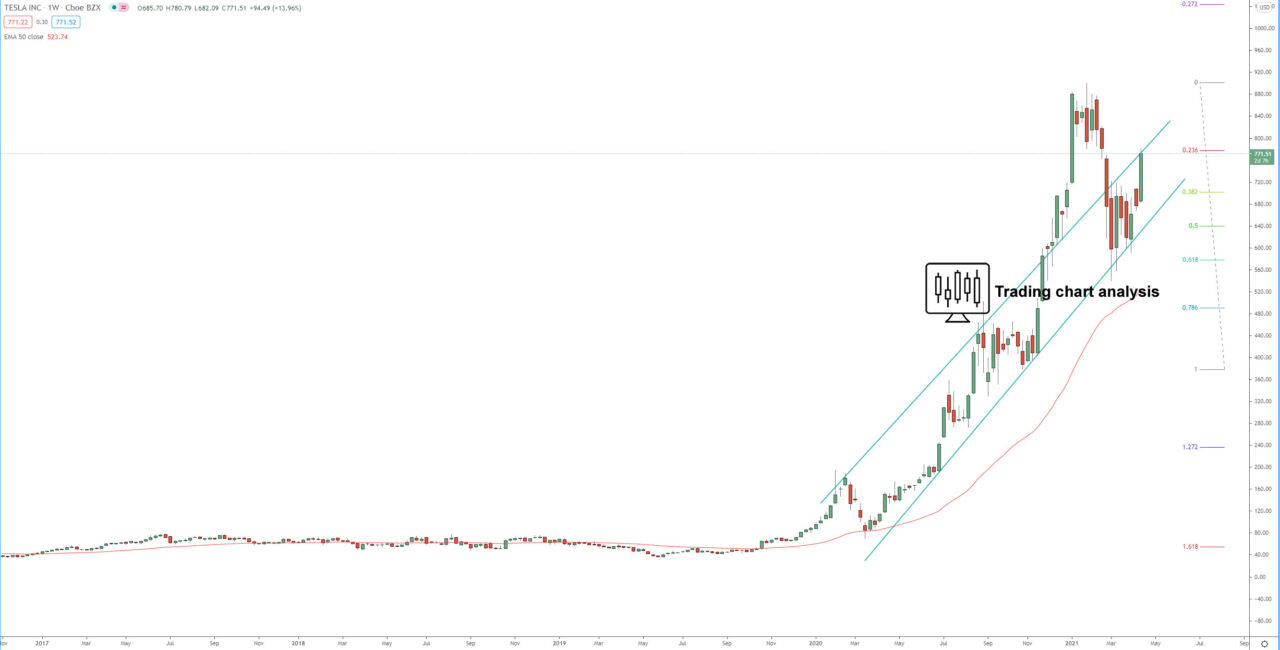
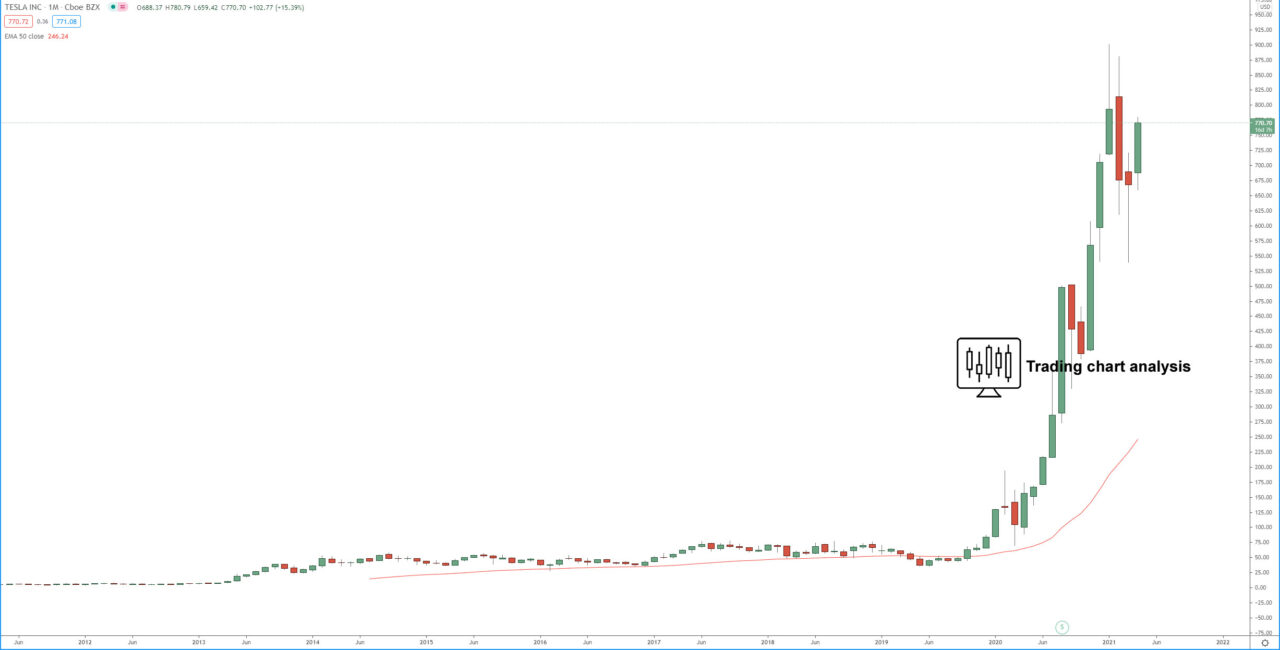
Technical analysis for Tesla (TSLA) shares is showing that the price formed a low-test candle on the monthly chart and bounced from ascending trend line and 0.618 FIB retracement on the weekly chart. That bounce on the weekly chart materialized as a breakout on the daily chart, break above 717$. The first target of this daily breakout is at 1.272 FIB extension at 817$, the second target is at 1.618 FIB extension at 880$, and the third is the previous all-time high at 900$.
If the shares of Tesla (TSLA) breakout above 900$, that will be a signal for resumption of the 3rd monthly bullish wave, and it will send the price higher toward, first 1.272 FIB extension at 925$, and second toward 1.618 FIB extension around 1070$ – 1085$.
On the other hand, if the Tesla (TSLA) shares break back below 667$, it will be a signal for the resumption of the daily bearish trend, and it will send the price low toward, firs 590$ and second the previous daily low at 539$. If the price break below 539$, that will be very bearish for the Tesla (TSLA) shares and could send the price lower toward 100% FIB extension at 462$ and second toward 1.272 FIB extension at 385$.
Review our technical analysis for Tesla (TSLA) shares for 2021 targets.
Daily chart:

Weekly chart:

Monthly chart:


