|
Getting your Trinity Audio player ready...
|
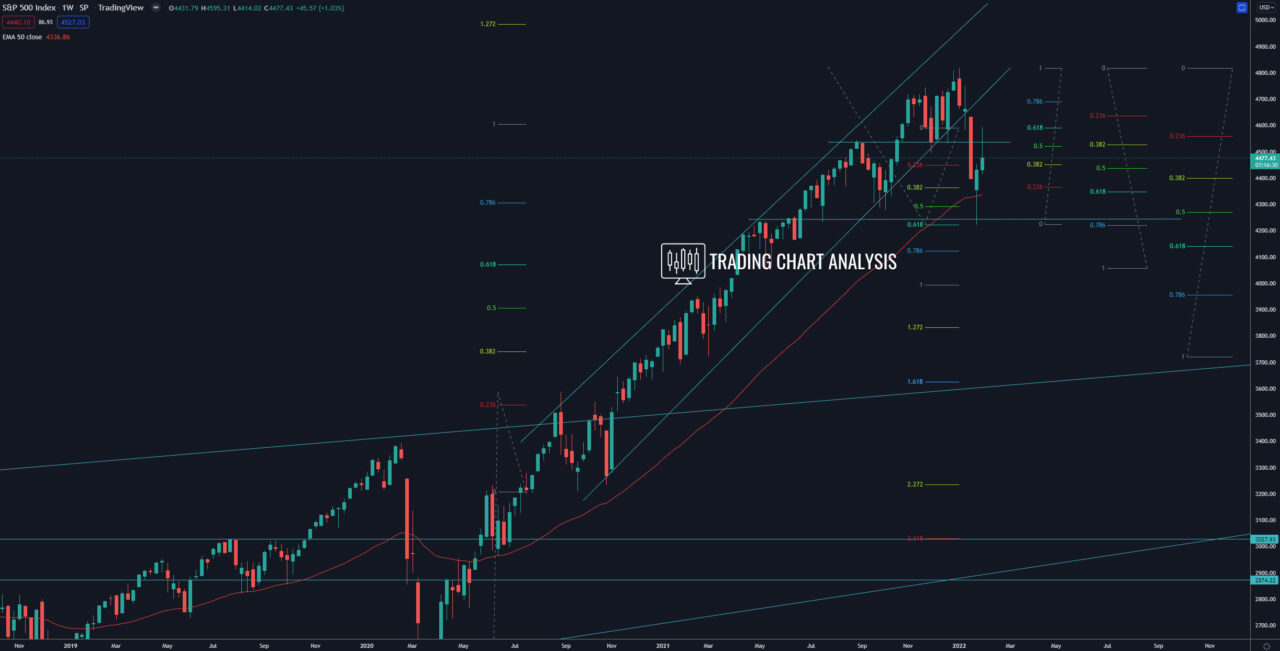
Technical analysis for S&P 500, the index retraced to the key 0.618 FIB retracement on the weekly chart at 4590. If the index breakout and holds above the 0.618 FIB retracement on the weekly chart at 4590, that will signal the resumption of the bullish trend. This potential bullish breakout will send the S&P 500 index higher toward first, the resistance at 4745. The second target is the previous all-time high at 4818. If the S&P 500 breaks above the all-time high at 4818, that will resume the weekly bullish wave and open the door for a bullish run toward the 1.272 FIB extension on the weekly chart at 4985.
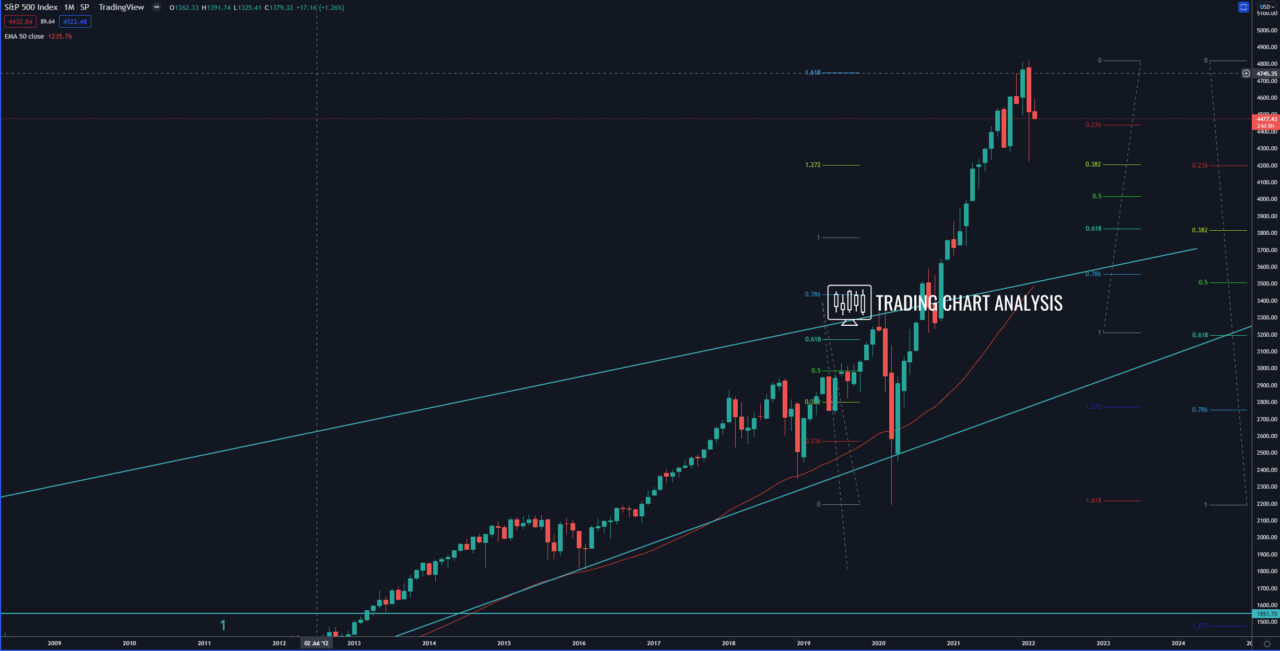
On the bearish side, if the index S&P 500 holds below the 0.618 FIB retracement at 4590 and eventually breaks below the weekly low at 4222, that will start a bearish run. The first target for this potential bearish development is the 1.272 FIB extension at 3830, close to the 0.618 FIB retracement on the monthly chart at 3820. The second target is the 1.618 FIB extension at 3625.
Weekly chart:

Monthly chart:


