|
Getting your Trinity Audio player ready...
|
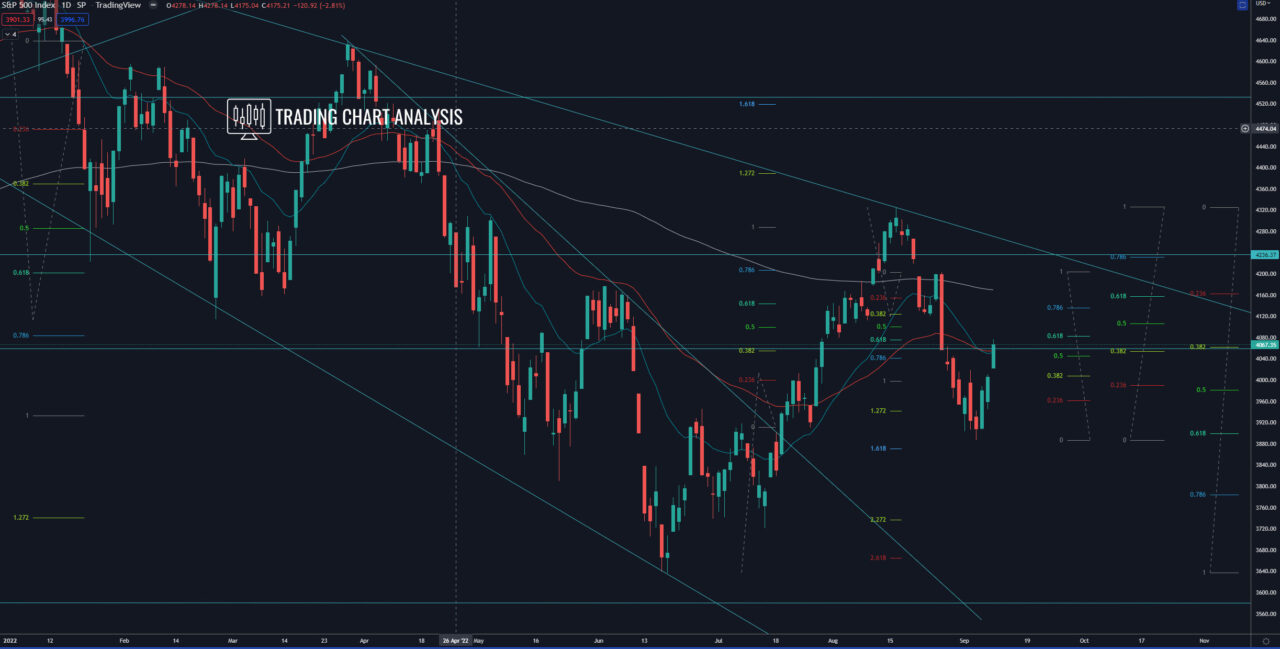
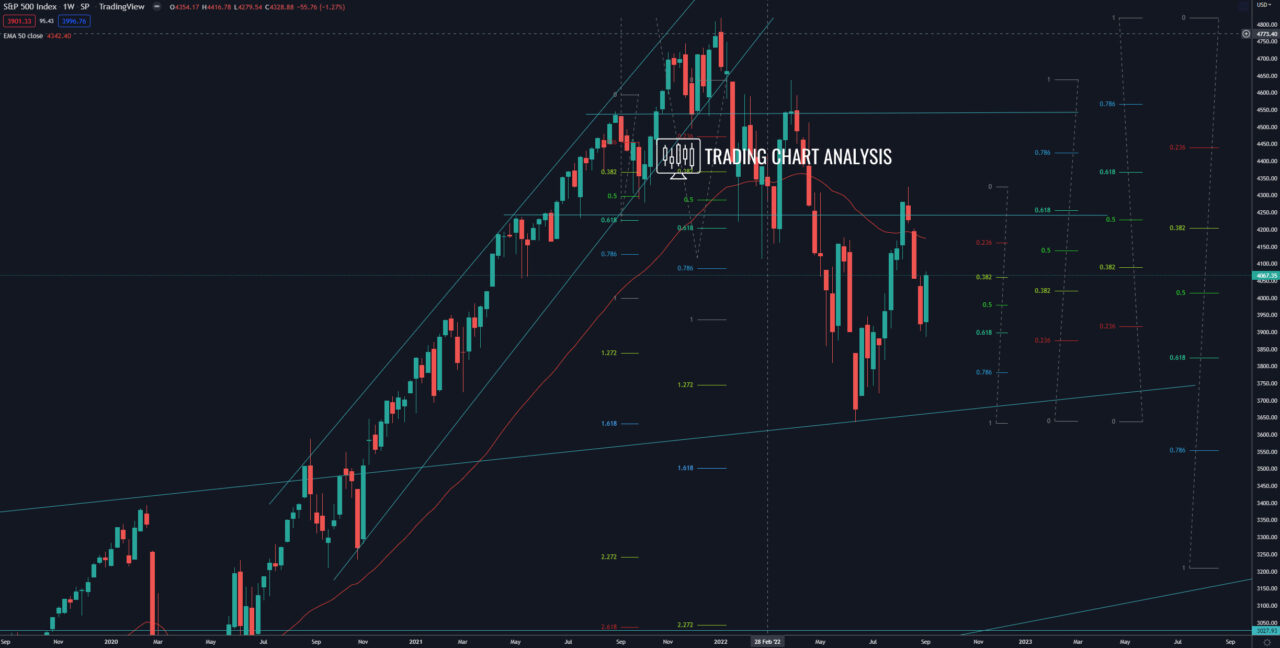
Technical analysis for S&P 500, the index bounced from the 0.618 FIB retracement on the weekly chart, starting a potential pullback on the daily chart. The first target for this pullback is the 0.618 FIB retracement on the four-hour chart at 4080-85. The second target is the 0.618 FIB retracement on the daily chart at 4155-60. If the S&P 500 breaks above 4160, that will be a signal for further upside potential toward, first, the minor resistance at 4200 and then toward the previous weekly high at 4325 and the 0.618 FIB retracement on the weekly chart at 4370.
On the other hand, if the S&P 500 index breaks below the daily low at 3886, that will open the door for further declines. The first target for such a bearish development is the 2.272 FIB extension on the daily chart at 3735. The second target is the previous low on the weekly chart at 3636, which is around the 2.618 FIB extension on the daily chart.
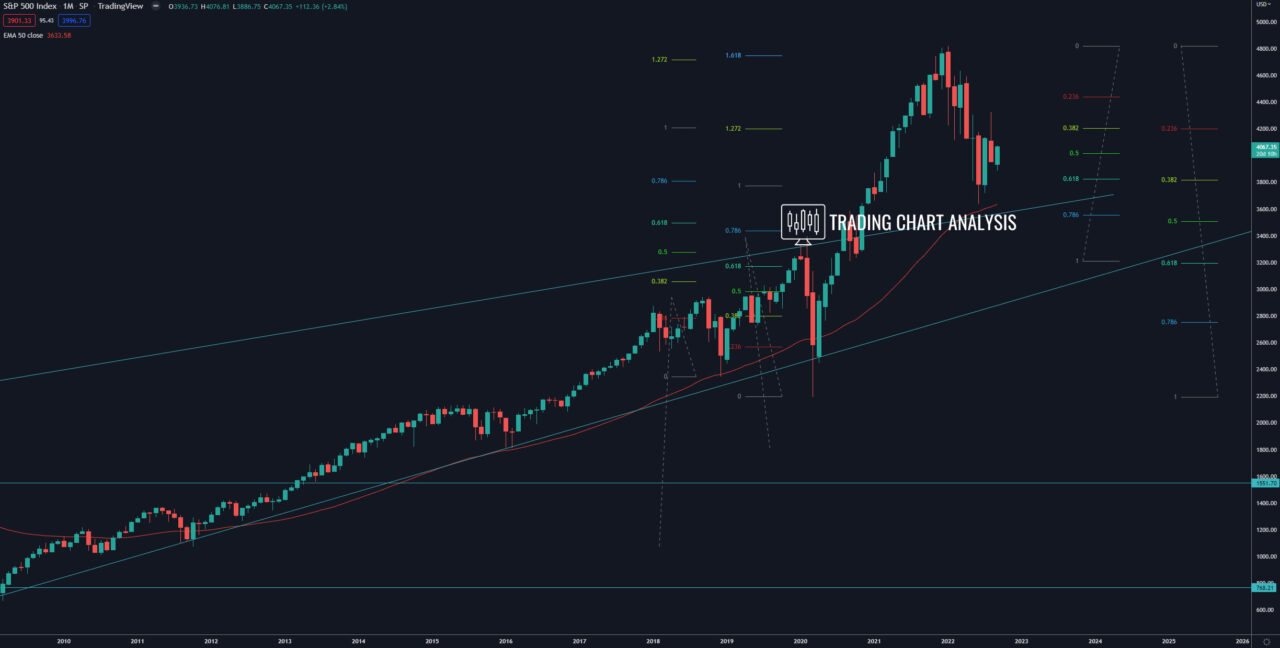
Looking at the bigger picture, on the monthly chart, the S&P 500 index closed below the 0.382 FIB retracement at 3815, which is a signal for further declines ahead. The focus now is on the previous monthly and weekly low at 3636, if the index breaks below 3636, that will clear the way for a bearish run toward the 0.618 FIB retracement on the monthly chart at 3200.
Daily chart:

Weekly chart:

Monthly chart:


