|
Getting your Trinity Audio player ready...
|
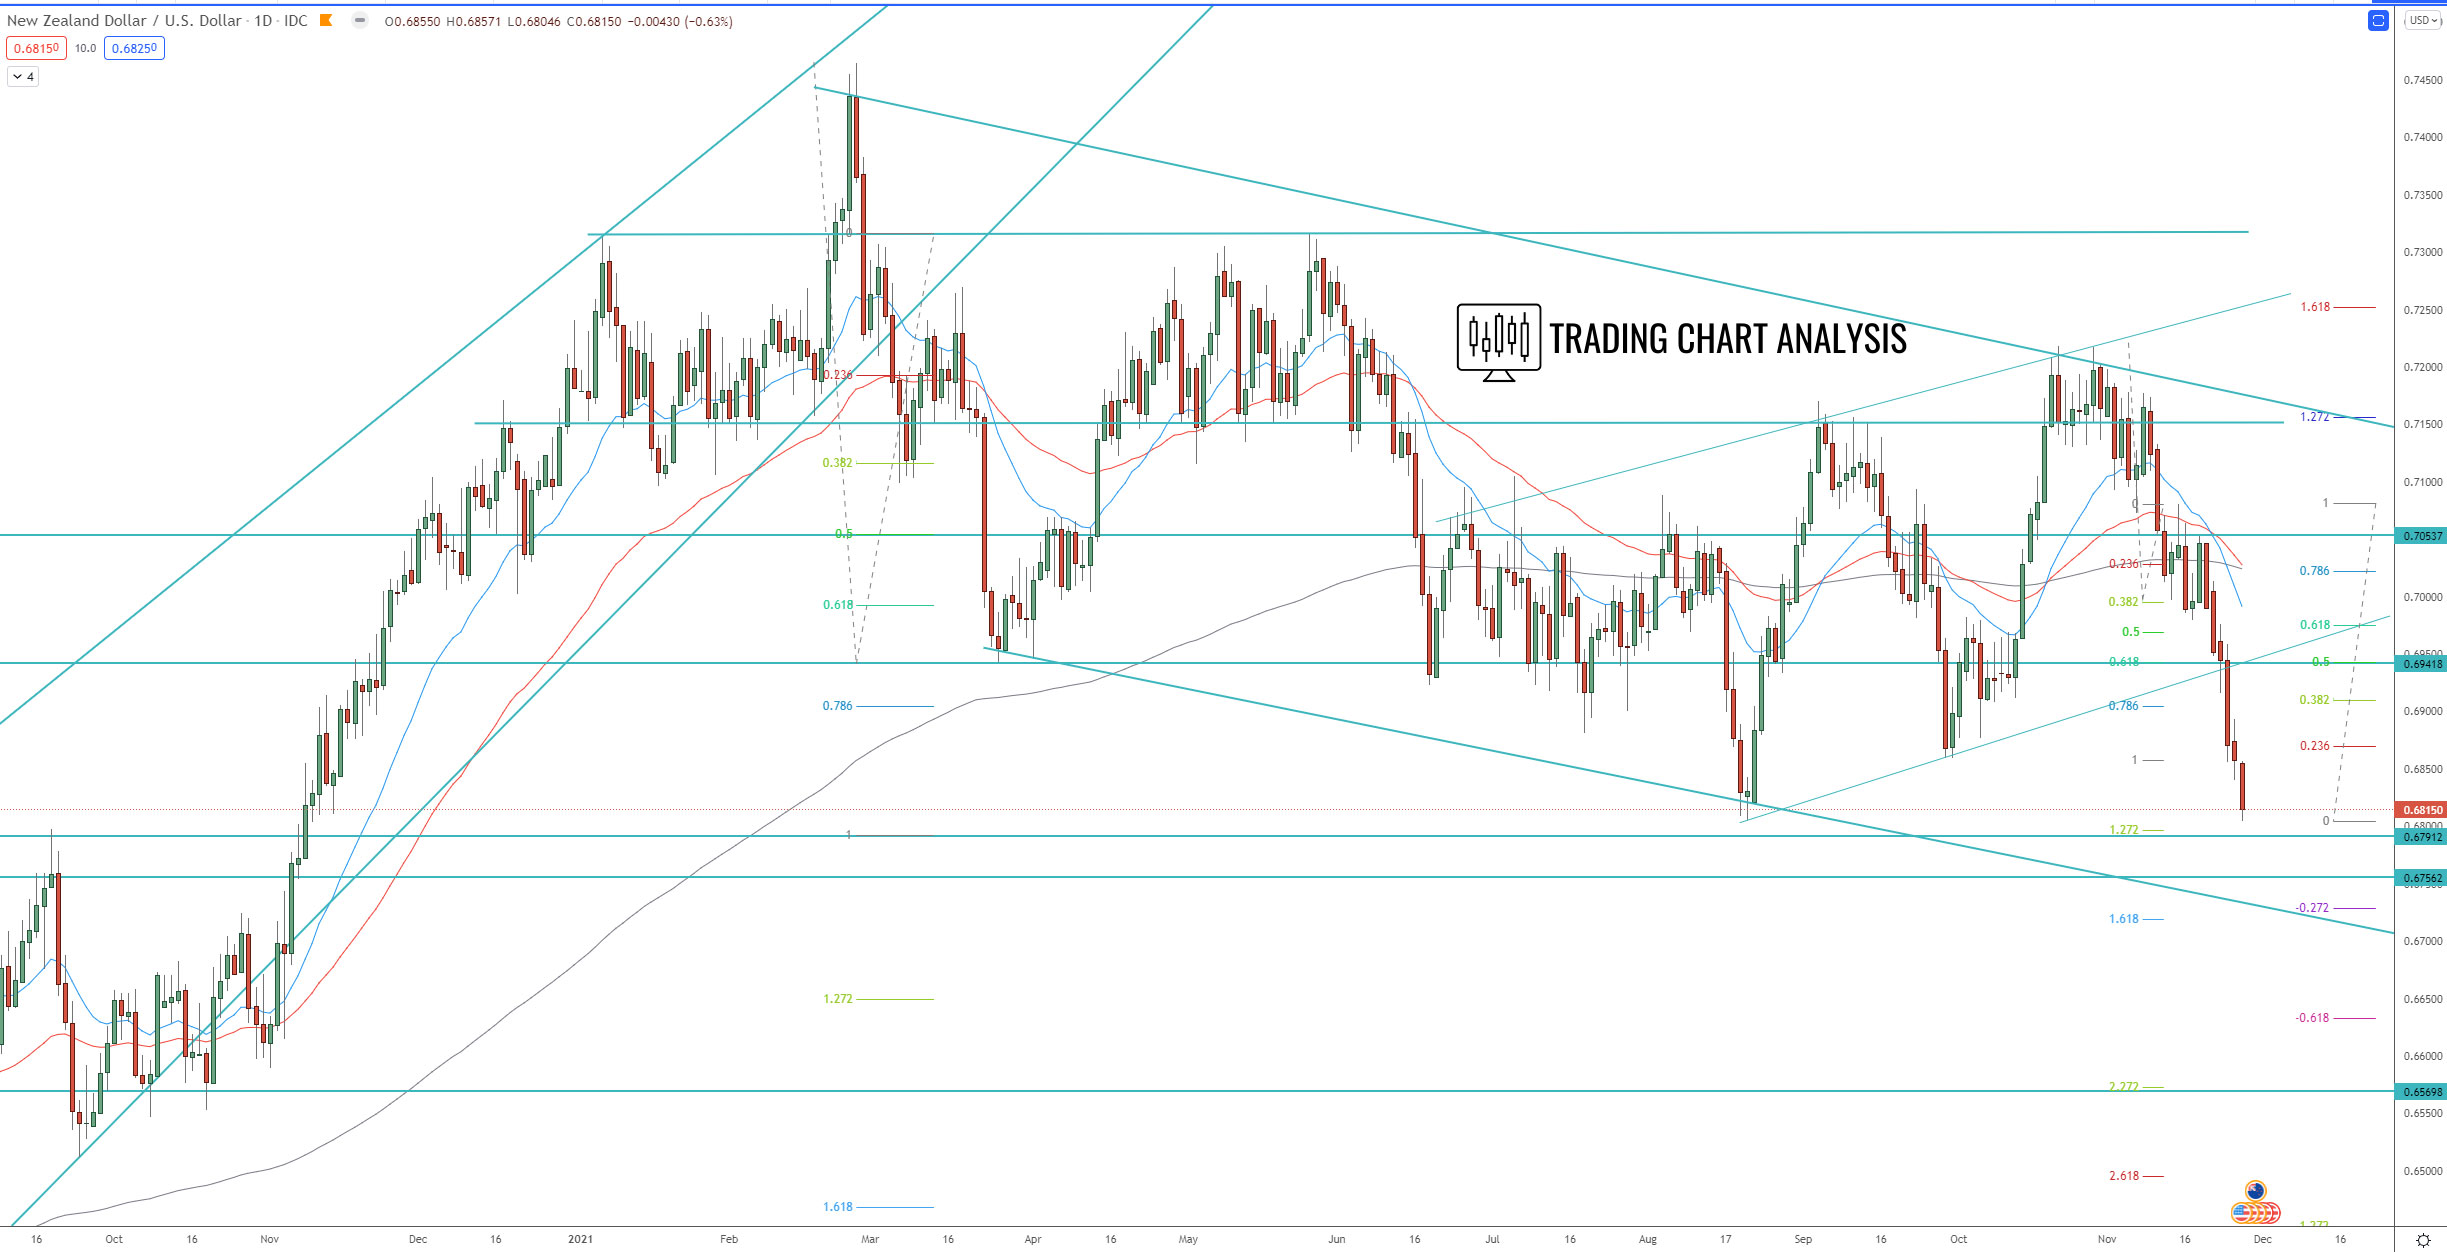
Technical analysis for the NZD/USD, the pair is within an important support zone and the previous monthly low at 0.6805. A break below 0.6805 will accelerate the bearish run, and it will send the price lower toward the 0.386 FIB retracement on the monthly chart at 0.6700. The next target for the bears will be the support zone between 0.6580 – 0.6515 and eventually the 1.272 FIB extension at 0.6385.
On the bullish side, if the NZD/USD holds above 0.6800, it will be a sign for begin of the consolidation phase and a range trading between 0.6800 – 0.6950.
Daily chart:
Weekly chart:

Monthly chart: