|
Getting your Trinity Audio player ready...
|
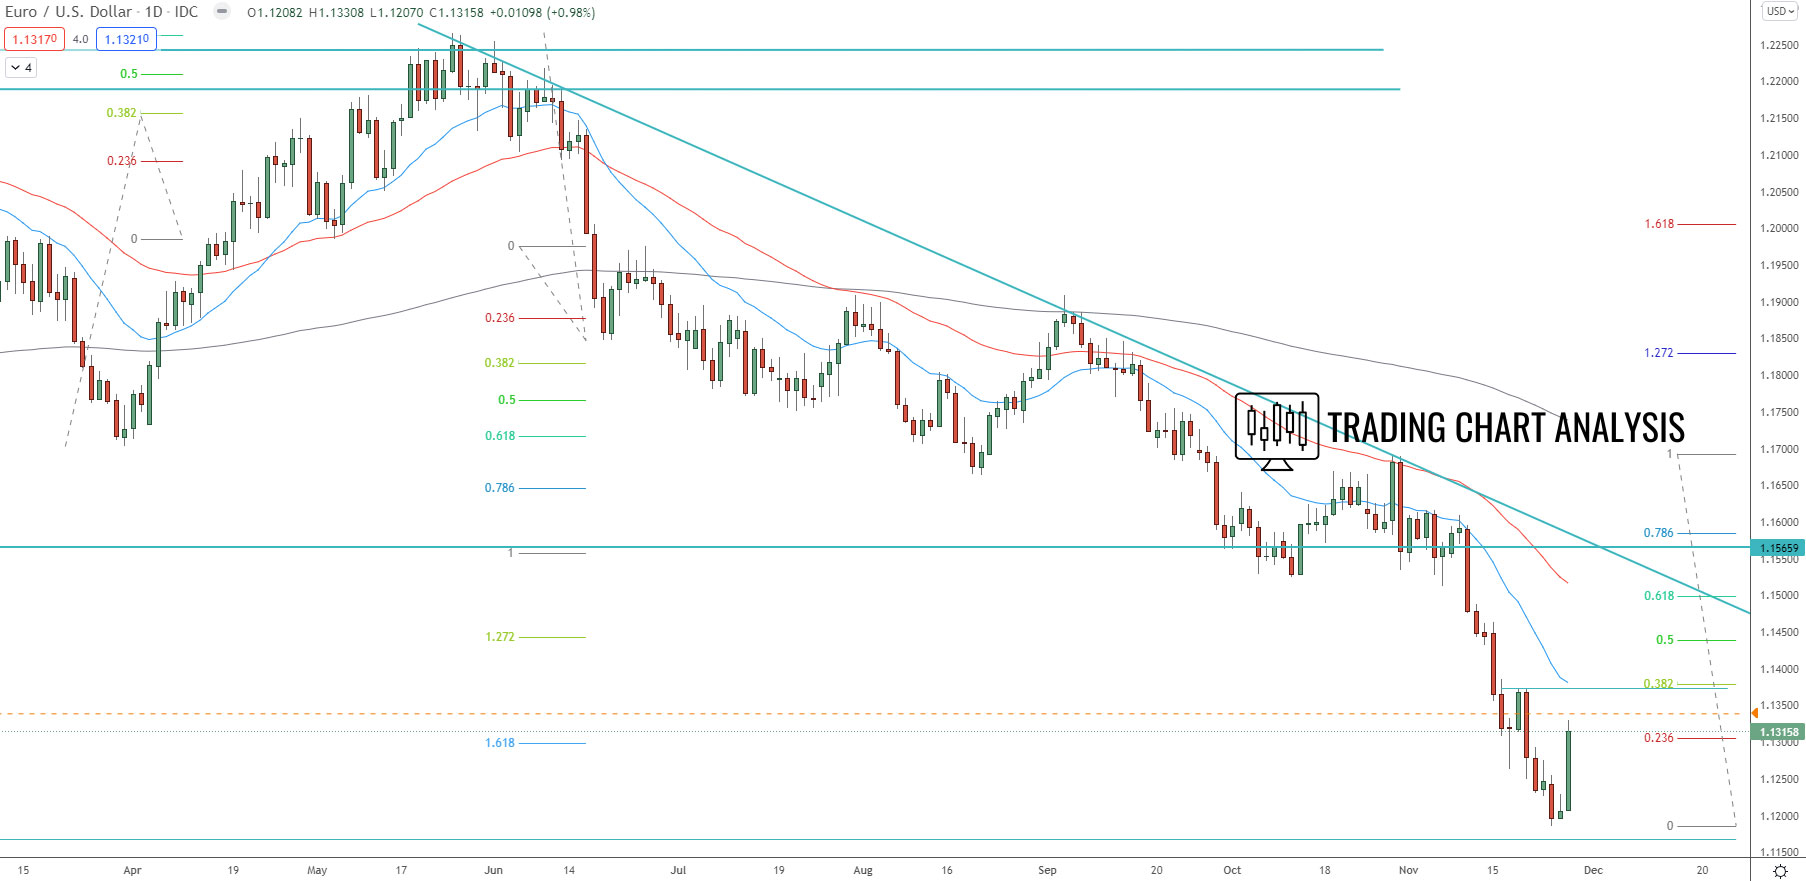
Technical analysis for the EUR/USD, the pair reached the second target of the bearish weekly wave at 1.618 FIB extension at 1.1225 and started a pullback. The EUR/USD went as low as 1.1182, which is at the top of the important support zone between 1.1168-1.1185, and bounced from it. If the EUR/USD breaks below 1.1168, it will open the door for a bearish run toward the 2.272 FIB extension at 1.0800. The second target for this potential breakdown is the 2.618 FIB extension at 1.0580.
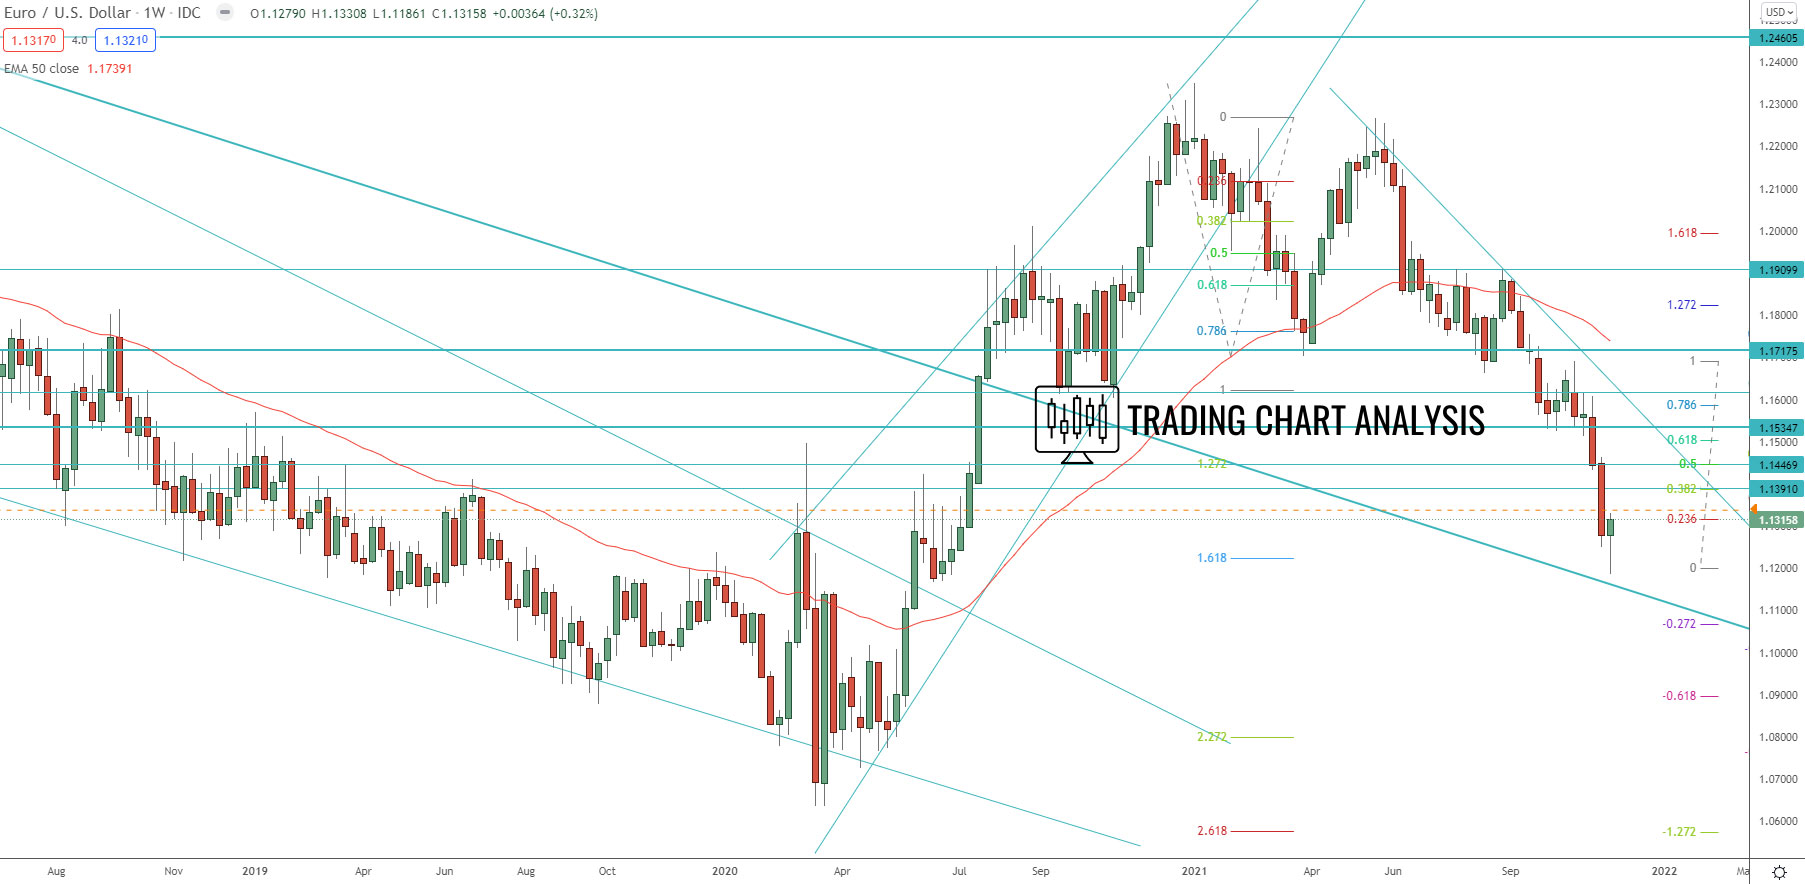
The EUR/USD pair closed the weekly chart with a low-test candle, a signal for a potential pullback. The first target for this pullback is the 0.386 FIB retracement at 1.1380. If the price breaks above 1.1380 it will open the door for a run toward 0.618 FIB retracement at 1.1500.
Daily chart:
Weekly chart:
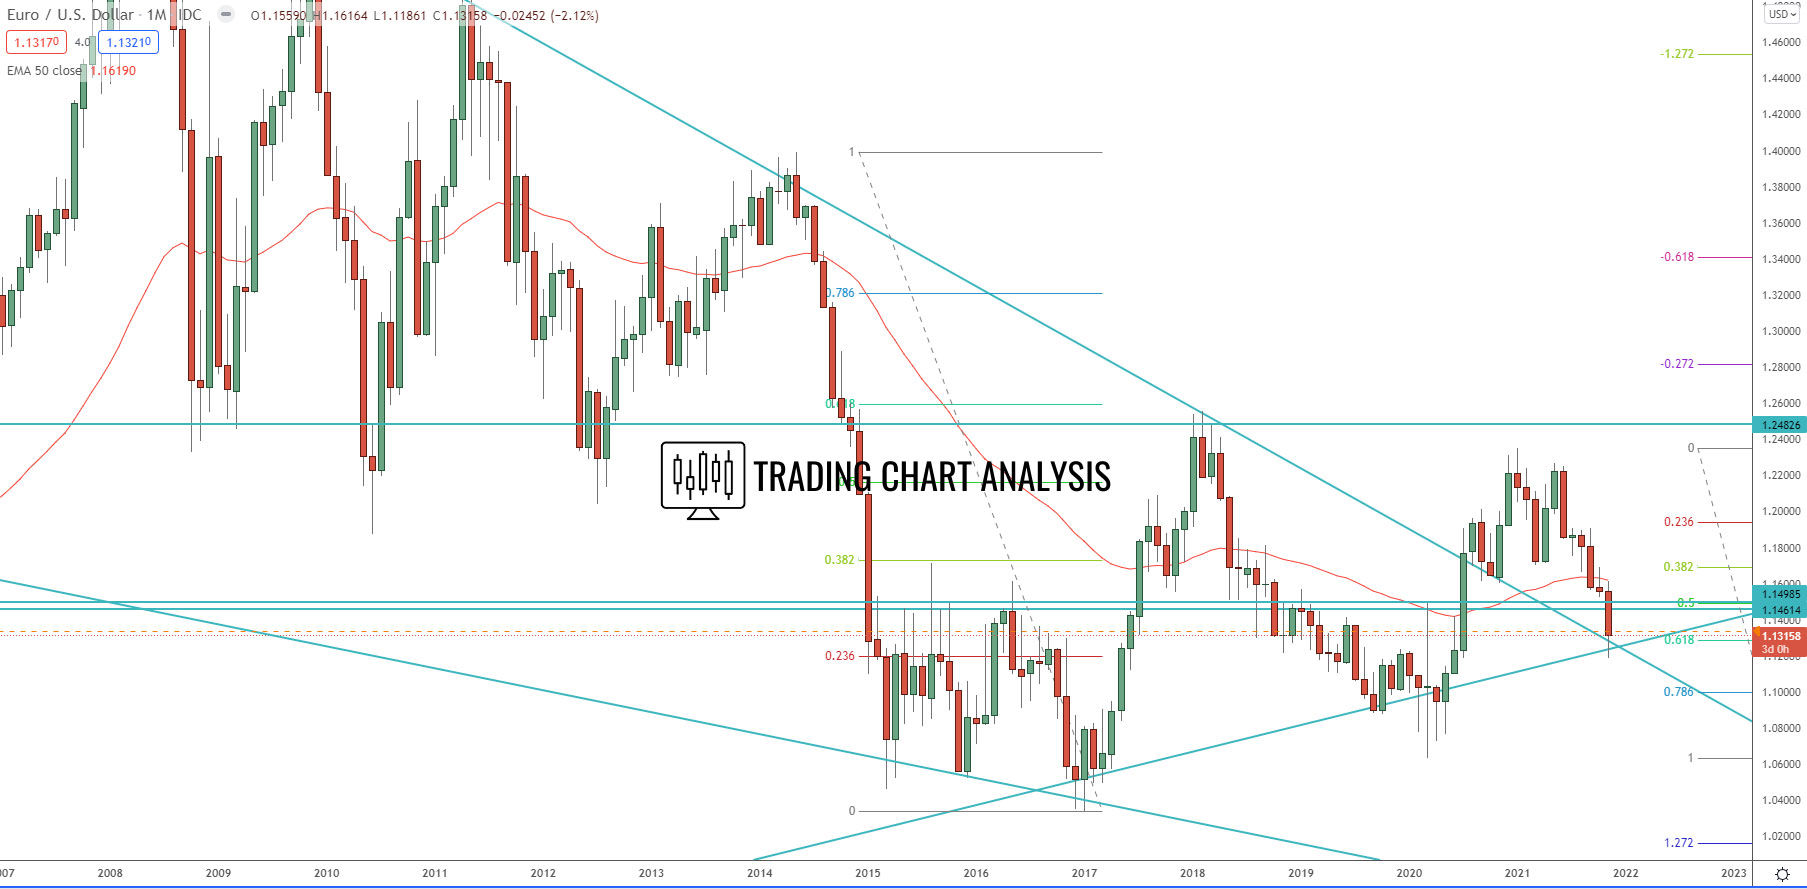
Monthly chart: