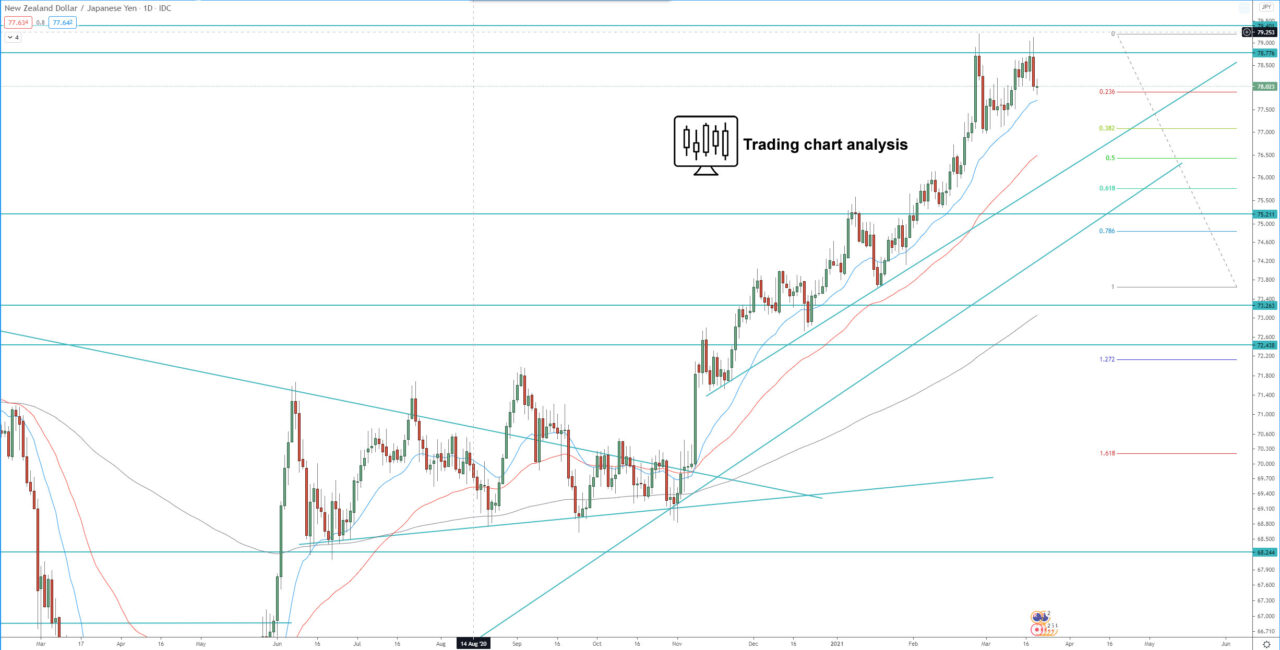
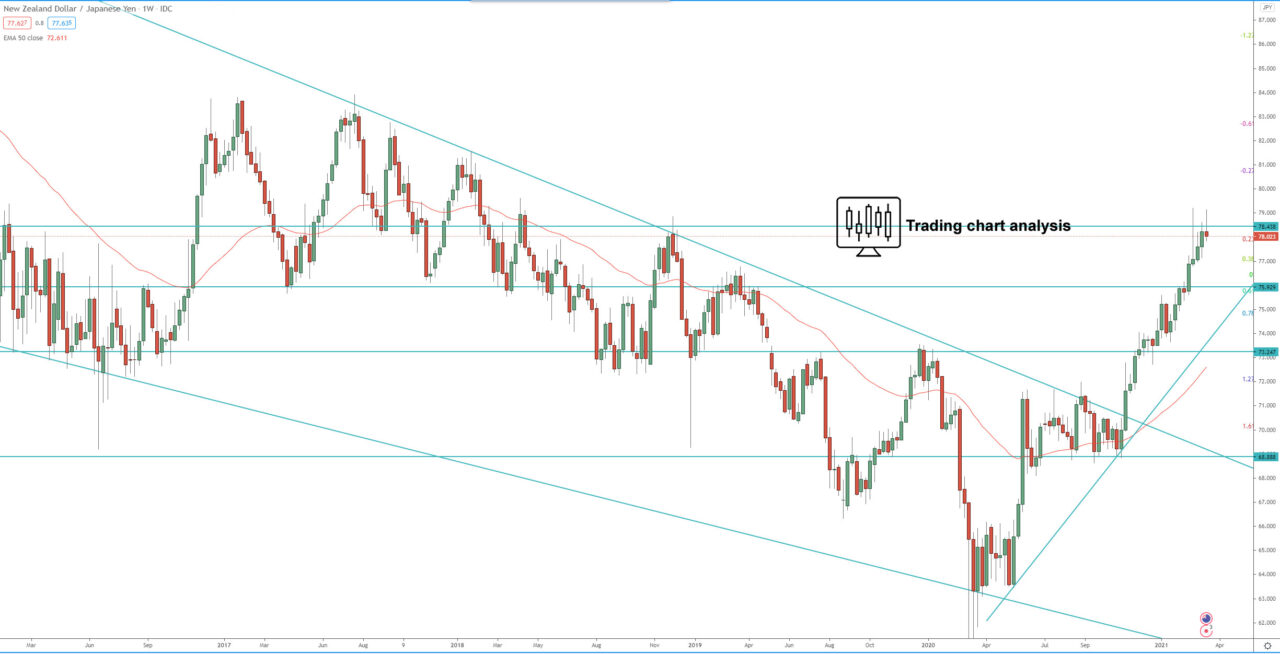
Technical analysis for NZD/JPY is revealing that the pair reached the 2nd target of the 3rd bullish daily wave and formed a double top on the daily chart. The price is overbought on the weekly chart and form bearish MACD divergence on the daily chart and close with a high-test candle on the weekly chart. All this is an early signal for a potential pullback. The first target of this potential pullback is at 0.386 FIB retracement at 77.00, if the price break below that, it will accelerate the decline toward 76.50.
Focus for the week ahead is on the previous weekly high and daily double tops now resistance at 79.21, if the price close above that level, it will send the pair higher toward, first 80.20, second toward the 1.272 FIB extension of the 3rd bullish weekly wave at 83.60.
On the other hand, if the NZD/JPY breaks below the previous minor daily low at 77.00, it will continue to decline toward 76.50, and perhaps even 76.00, we need more price action for the additional targets of this potential decline.
Daily chart:

Weekly chart:


