|
Getting your Trinity Audio player ready...
|
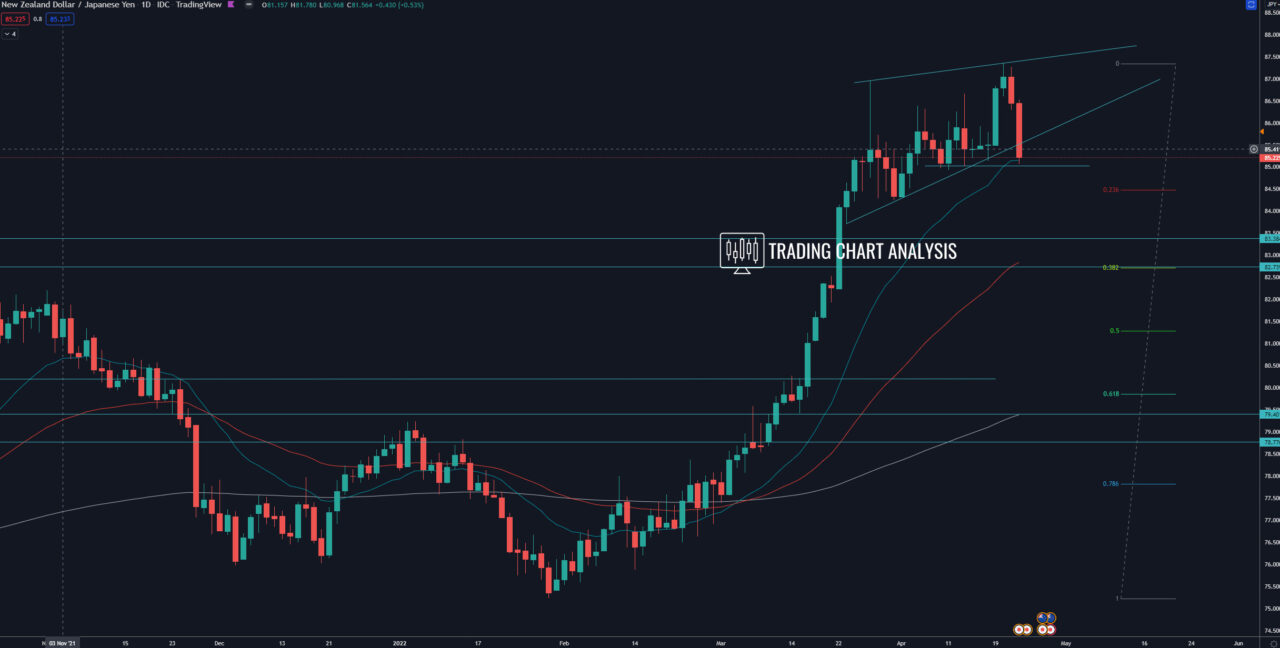
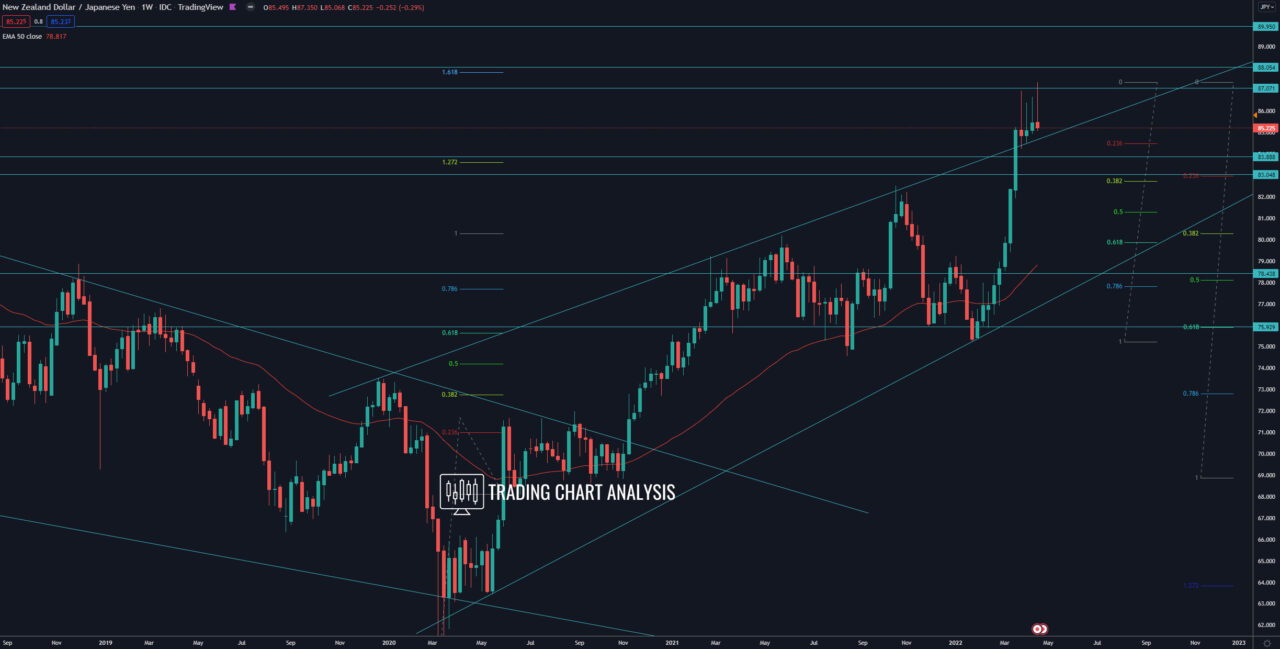
Technical analysis for NZD/JPY, the pair rejected resistance and 0.786 FIB retracement at 86.65 with a high-test candle pattern forming a tweezer top on the weekly chart. On the daily chart, the NZD/JPY is consolidating and attempting to break below an ascending wedge, which is another sign of a potential pullback. A break below the range on the four-hour chart, below 84.90, will start the pullback. The first target for the potential pullback is the support zone between 83.90 and 83.30. The second target is the daily 50 EMA and the 0.382 FIB retracement at 82.75.
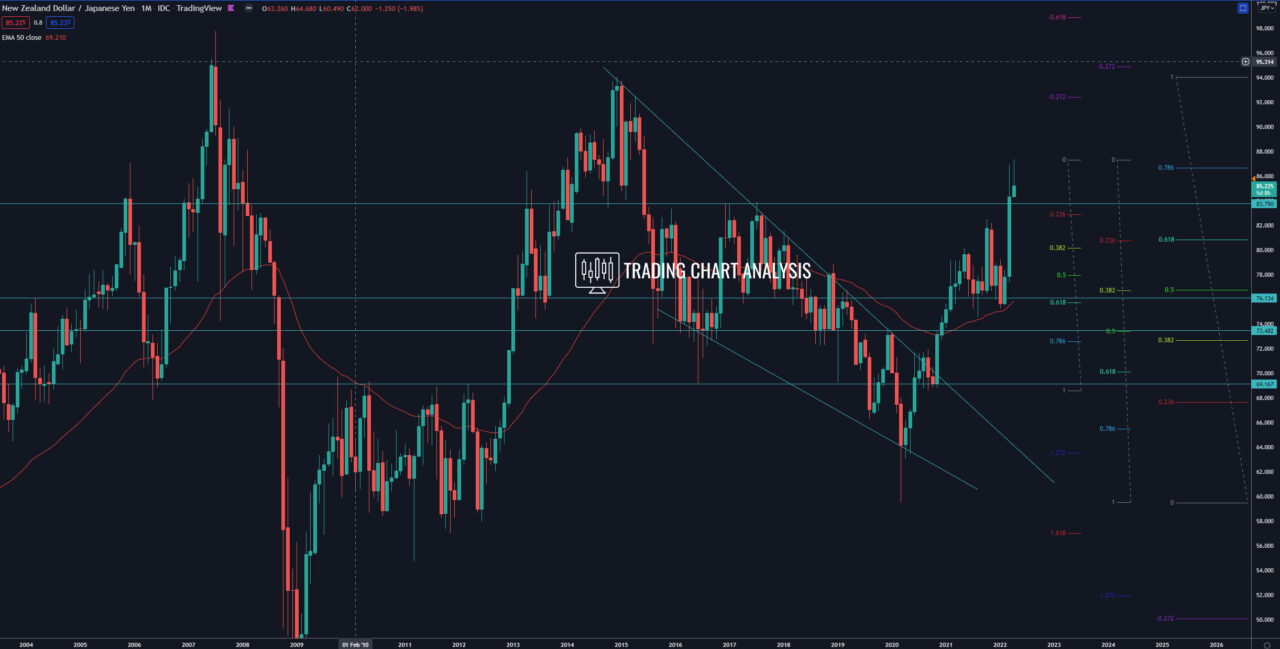
On the other hand, the bullish run in the NZD/JPY failed short to reach the second target of the bullish wave on the weekly chart, the 1.618 FIB extension at 87.80. Also, the NZD/JPY pair broke above the 2016 and 2017 high, above 83.91, which is significant, and it is opened the door for a bullish run toward 90.00 and eventually toward the high on the monthly chart at 94.05.
Daily chart:

Weekly chart:

Monthly chart:


