|
Getting your Trinity Audio player ready...
|
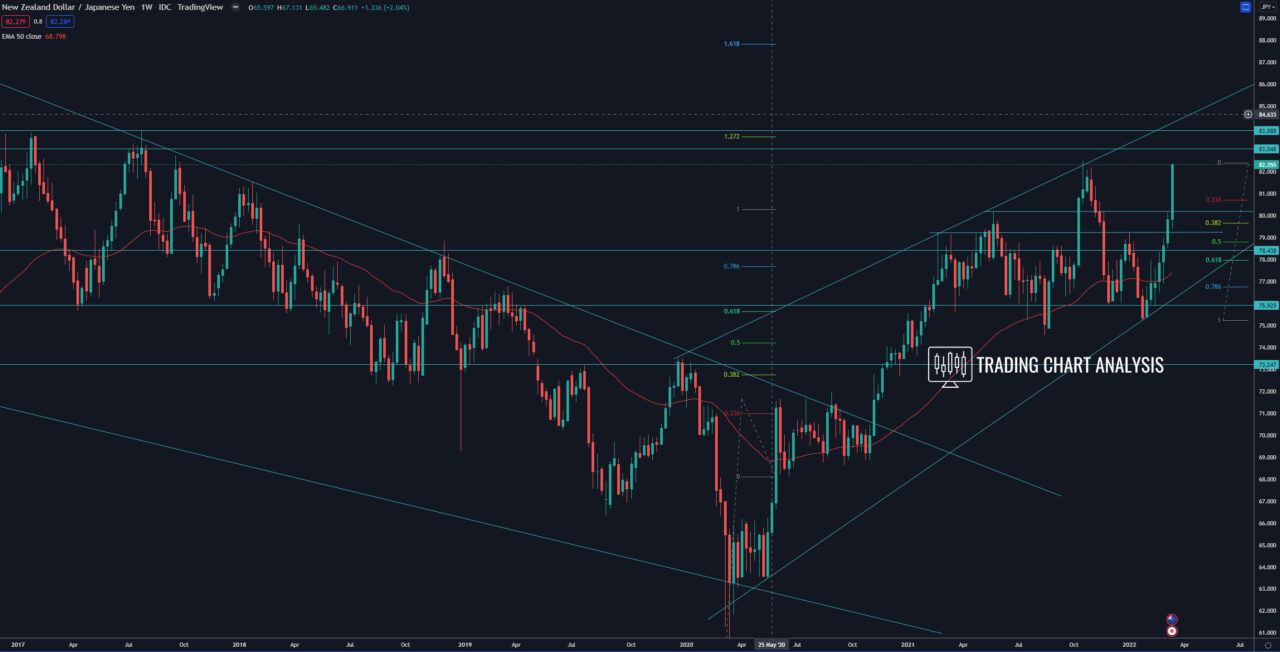
Technical analysis for NZD/JPY, the pair broke above the previous weekly high at 79.24, resuming the bullish wave on the weekly chart. The first target for this bullish wave is the 1.272 FIB extension on the weekly chart at 83.60. Just above 83.60, there is the high of 2017 at 83.91, which is key resistance. If the NZD/JPY break above 83.91, that will have a significant bullish implication and send the pair higher toward the second target for the bullish wave on the weekly chart, the 1.618 FIB extension at 87.80.
The NZD/JPY is overextended on the weekly chart and overbought on the daily chart, and it needs a pullback. The first support to watch for rejection and resumption of the trend is the area around 80.25. The second is the low on the daily chart at 79.40.
Weekly chart:


