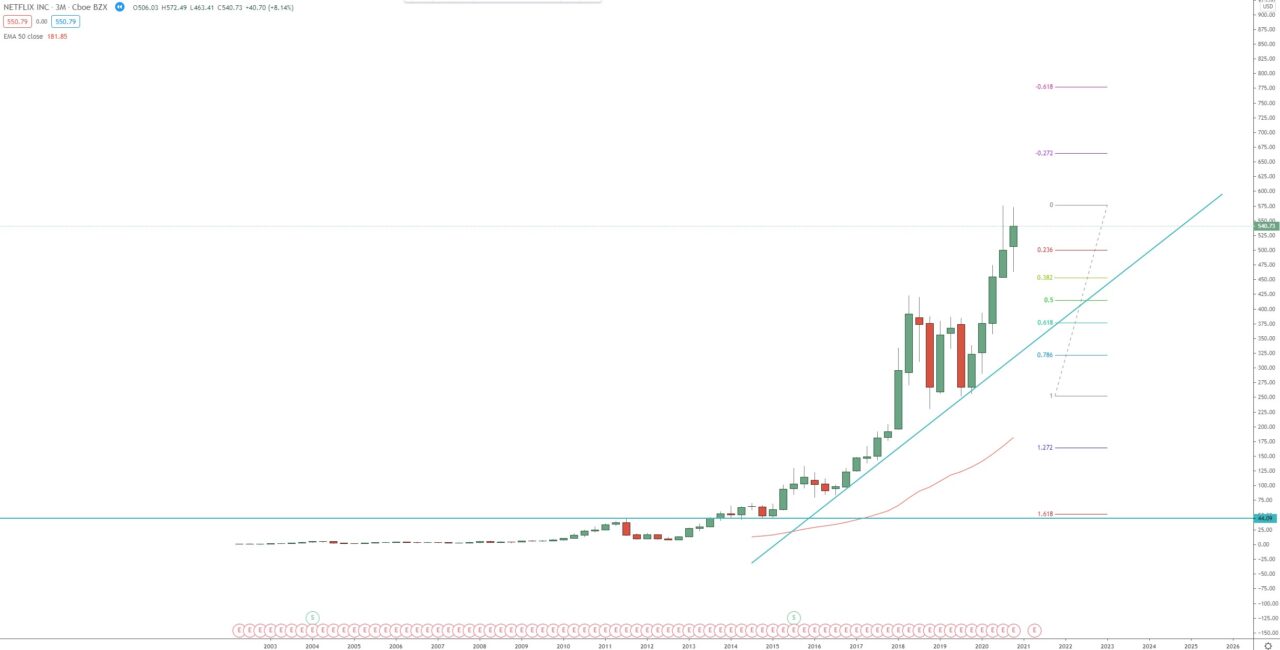
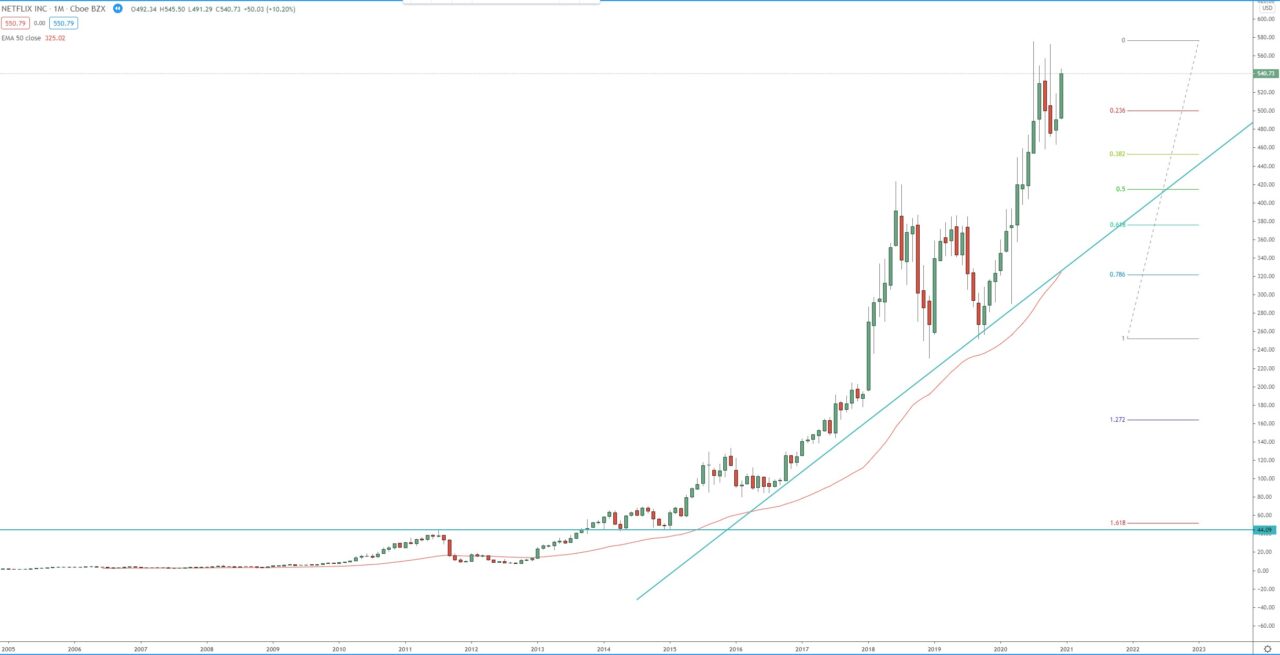
In 2018 the price reached the 2.618 FIB extension of the 3rd bullish monthly wave, around 410.00, and started a 4th pullback wave with -45.00% decline.
In April 2020 we witnessed break above the 2018 high, above 423.00, which extended the 5th monthly bullish wave toward 100% extension around 575. That triggered -20.00% decline and since then the price is consolidating in a range, between 458.00 – 572.00. Break above this range will extend the 5th monthly bullish wave toward 1.272 FIB extension around 665.00. Break below the range, below 458.00 will trigger deeper monthly pullback possible ABC pullback with target 0.618 FIB retracement around 375.00.
Quarterly chart:

Monthly chart:


