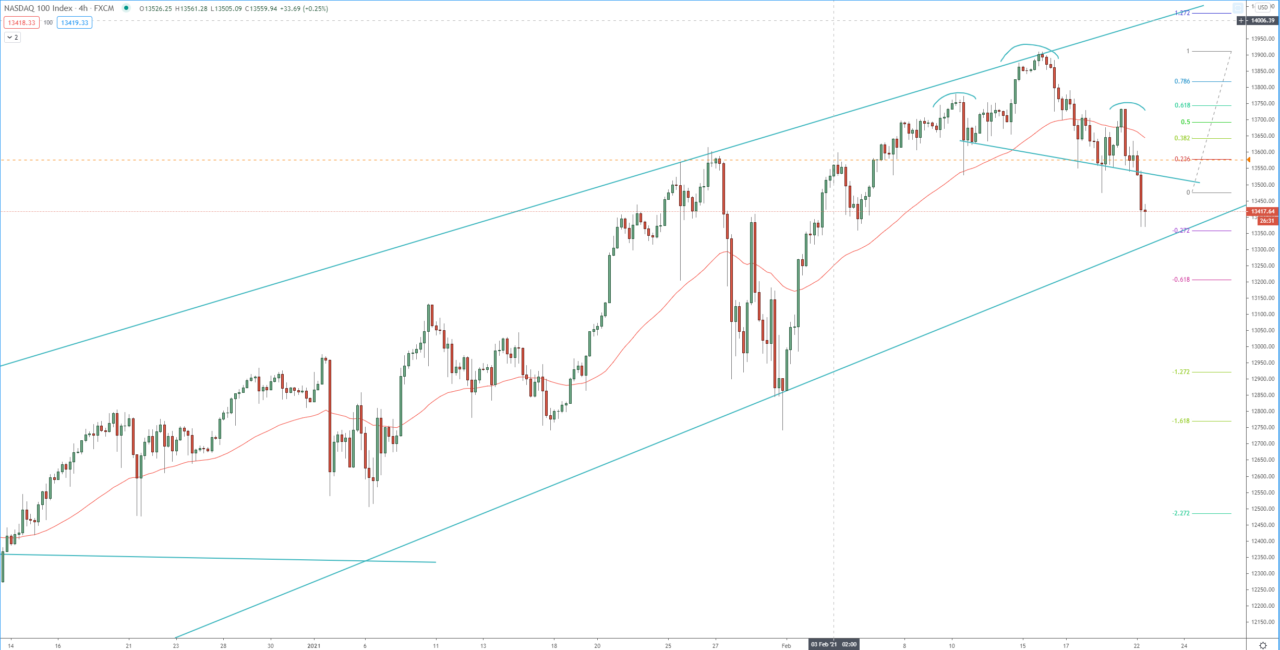
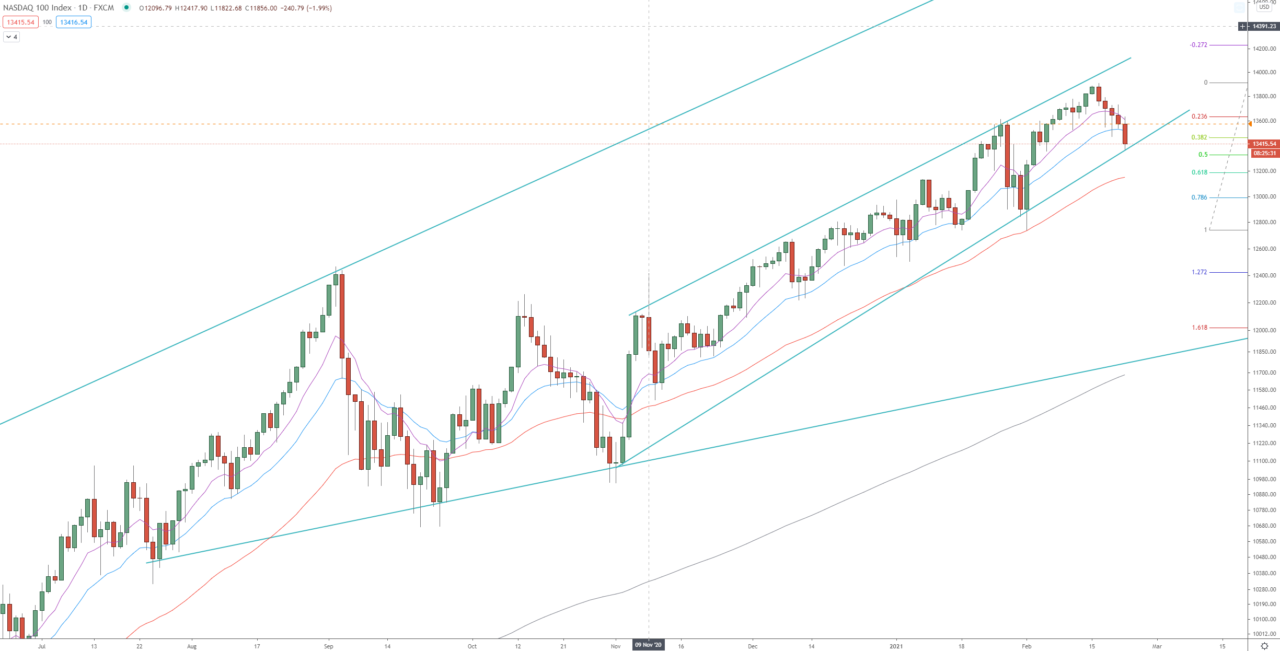
Looking at the 4H chart of the CDF, the price formed Head and Shoulders and broke below the neckline on Monday the 22 February when the futures market opened. This breaks down continues the daily pullback that started last week and confirmed the bearish run on the 4H chart. The first target of the 4H at 1.272 FIB extension around 13 180, the second target is at 1.618 FIB extension around 13 030. However, the price is facing dynamic support (ascending trend line) and we need to see a break below it to confirm the 4H bearish run toward 13 030. Break below 13 030 will send the price lower toward the previous daily low and support between 12 730 – 12 780 range.
On the other hand, if the price breaks back above 13 735 it will invalidate this 4H bearish run and will resume the bullish daily trend and send the price back toward the previous high around 13 910.
Review our 2021 technical analysis for NASDAQ 100.
4H chart:

Daily chart:


